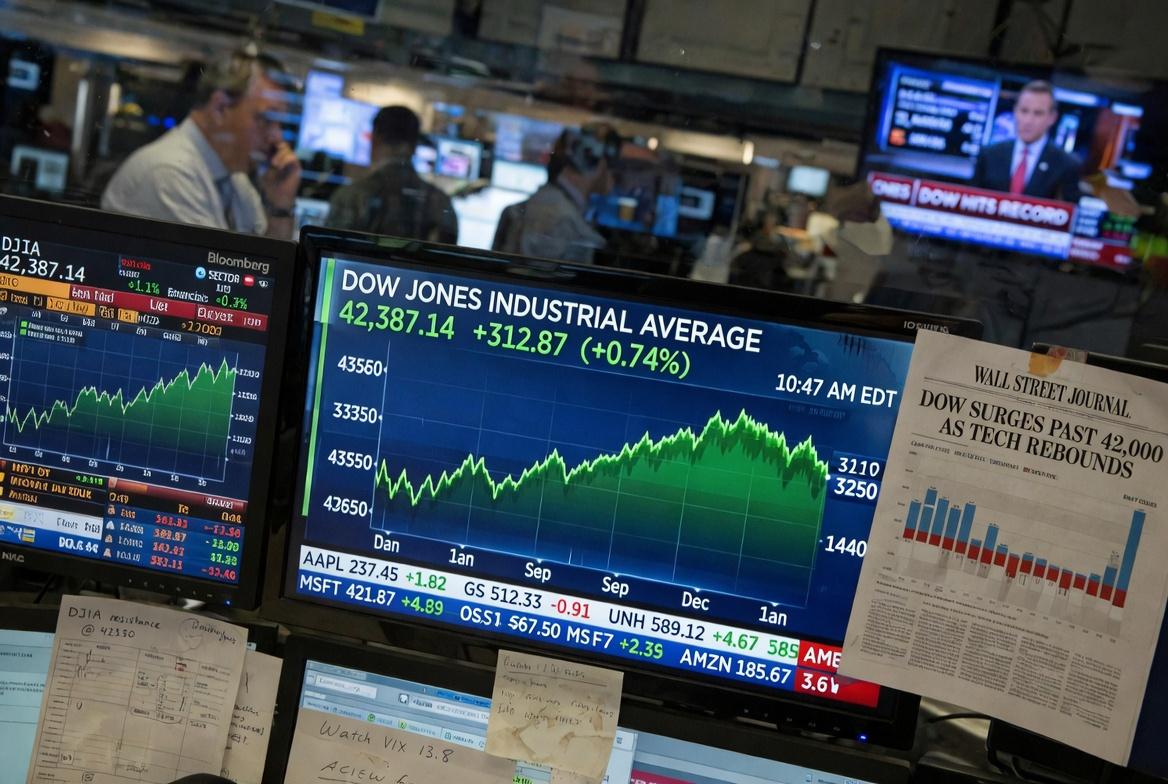
The Dow Jones Industrial Average (DJIA) in 2026 has demonstrated the resilience of blue-chip America while navigating one of the most complex macro environments in recent memory. With the index recently reaching an intraday high of $51,126 on May 25, 2026, and analysts projecting a year-end target range between $54,605 and $64,542, the DJIA remains a central barometer of U.S. economic health and investor confidence. Here is a complete, data-driven breakdown of everything driving and threatening the Dow Jones right now.
Dow Jones 2026: Where the Index Stands Today
As of late May 2026, the Dow Jones closed around the $49,600 level, having pulled back modestly from its recent high. The index has experienced a strong 30-day uptrend of +6.65%, with a monthly trading range spanning from a low of $46,214 to a high of $50,200. The 20-day moving average sits at $49,477 and the 50-day at $48,036, with the index currently trading above both short-term averages a constructive technical signal.
The 14-day RSI reading of 56.7 places the index in neutral-to-positive territory, suggesting balanced momentum without the overheated signals that typically precede sharp corrections. Key technical support is identified at $46,214 while the immediate resistance ceiling sits near $50,200.
| Metric | Value (May 2026) |
|---|---|
| Current Level | ~$49,600 |
| Recent 30-Day High | $50,200 |
| 2026 Intraday Peak | $51,126 (May 25) |
| 20-Day Moving Average | $49,477 |
| 50-Day Moving Average | $48,036 |
| 14-Day RSI | 56.7 (Neutral) |
| Key Support | $46,214 |
| Key Resistance | $50,200 |
What Is Driving the Dow Jones in 2026?
Value Rotation and Blue-Chip Demand
One of the defining themes of 2026 has been a significant rotation away from high-multiple growth and AI-adjacent software stocks toward the established, dividend-paying companies that dominate the DJIA. A re-steepening yield curve and the emerging outperformance of the value factor have improved the relative prospects for the Dow Jones Industrial Average, according to OANDA analysis. As growth stocks face pressure from rate uncertainty, capital has been flowing into the blue-chip stability that defines the Dow’s 30 components.
Investors seeking stability and income particularly insurance companies, pension funds, and retirees have found the DJIA’s composition increasingly attractive in a market environment where momentum-driven mega-cap tech has become more volatile.
Earnings Breadth Beyond Technology
While the broader S&P 500 delivered Q4 2025 earnings growth of 14.2% (the fifth straight quarter of double-digit growth), the gains were not limited to technology. Industrials, healthcare, and financial services all sectors with heavy Dow Jones representation contributed meaningfully to the earnings beat cycle. With Q2 2026 EPS estimates revised higher and positive guidance outpacing negative, the Dow’s diversified sector composition is well-positioned to benefit from broad-based profit growth.
Federal Reserve Policy and Interest Rates
The Federal Reserve rate trajectory remains the most consequential variable for the Dow Jones in 2026. With GDP growth coming in below consensus expectations and Core PCE inflation printing above 3%, the Fed faces a stagflationary dilemma. The prevailing market view, supported by Nasdaq analysis, is that rate cuts remain possible in H2 2026 but any delay or reversal would weigh particularly on rate-sensitive DJIA components such as real estate investment trusts, utilities, and financial stocks.
Not all analysts are bullish. Trading Economics maintains a projection of 42,639 for the Dow Jones within the next 12 months, reflecting concerns about elevated valuations, policy errors, or economic slowdown. This range of outcomes from 42,000 to 64,000 across different forecasting models — reflects the genuine uncertainty in the current macro environment.
Dow Jones 2026 Forecast: What Analysts Are Saying
The full range of analyst forecasts for the Dow Jones at year-end 2026 is strikingly wide, reflecting divergent assumptions about Fed policy, geopolitics, and corporate earnings momentum:
| Source / Model | DJIA End-2026 Target | Bias |
|---|---|---|
| Long Forecast (cycle/seasonal) | $64,542 | Strongly bullish |
| LiteFinance analytical consensus | $58,133 | Bullish |
| BeCoin AI model (1-year) | $55,240 | Moderately bullish |
| WalletInvestor technical | $53,717 | Mildly bullish |
| Trading Economics | $42,639 | Bearish |
The consensus leans bullish, but the wide dispersion across models is itself a risk signal. Investors should treat any single forecast with appropriate skepticism and instead focus on the directional drivers and risk factors outlined below.
Key Risks to the Dow Jones Outlook in 2026
Geopolitical Risk and Commodity Prices
March 2026 delivered a stark reminder of how geopolitical shocks can disrupt even the most defensive indices. Energy prices surged dramatically crude oil strengthened +24% year-to-date at one point and the Bloomberg Commodity Index posted its strongest monthly gain since May 2009. While energy exposure is a smaller component of the Dow than industrials and financials, rising input costs across the economy ultimately compress profit margins for Dow constituents in manufacturing, retail, and consumer staples.
Debt Ceiling and Fiscal Policy Uncertainty
Analysts flagging the 50,000-point cap scenario point to U.S. debt ceiling debates and election-year fiscal spending dynamics as a potential governor on upside. With midterm elections approaching later in 2026, any escalation in partisan fiscal standoffs or credit rating concerns for U.S. government debt could quickly translate into equity market turbulence, historically hitting the blue-chip DJIA harder than the technology-heavy Nasdaq.
Economic Slowdown Signals
GDP growth came in at roughly half its consensus 2.8% expectation in Q1 2026. While the Fed’s preferred interpretation is that this reflects a transitory payback from a strong 2025 rather than a structural deterioration, three consecutive quarters of below-consensus growth would begin to pressure cyclically sensitive DJIA components. The index is meaningfully weighted toward industrials, financials, and consumer discretionary all sectors that experience direct margin pressure when economic activity softens.
How to Invest in the Dow Jones in 2026
The most straightforward way for retail investors to gain exposure to the DJIA is through ETFs such as the SPDR Dow Jones Industrial Average ETF Trust (DIA), which tracks all 30 Dow components proportionally. For investors seeking leveraged exposure or inverse positions for hedging purposes, products such as ProShares Ultra Dow 30 (DDM) and ProShares Short Dow 30 (DOG) exist though these are short-term instruments not suited for long-term buy-and-hold strategies.
For active stock pickers, the Dow’s 30 components represent some of the most liquid and deeply researched equities in global markets. In 2026’s rotation environment, Dow components in industrials (Caterpillar, Honeywell), healthcare (UnitedHealth, Johnson & Johnson), and financials (Goldman Sachs, JPMorgan Chase) have benefited from the value rotation dynamic and offer yield alongside capital appreciation potential.
Dow Jones vs. S&P 500 and Nasdaq in 2026: The Relative Picture
Through February 2026, the Dow Jones outperformed both the S&P 500 and Nasdaq-100 on a relative basis, with its blue-chip value composition benefiting from the growth rotation. However, April’s historic Nasdaq rebound reversed this dynamic temporarily. The longer-term question for 2026 is whether the value rotation is structural driven by fundamental earnings catch-up in cyclical sectors or tactical, driven by mean reversion after years of growth outperformance. The answer to that question will determine whether the Dow Jones sustains its relative outperformance through year-end or cedes leadership back to technology.
Dow Jones 2026: Key Levels and Dates to Watch
- $50,200: Immediate resistance; a sustained close above this level opens the path toward $53,000 and beyond.
- $46,214: Key support from the 30-day low a break below this level on high volume would signal a meaningful correction.
- Q2 2026 earnings season (July): First major catalyst for testing whether bullish EPS revisions hold.
- Federal Reserve meetings H2 2026: Rate cut signals would be a significant bullish catalyst; any hawkish pivot would be the largest downside risk.
- U.S. midterm election dynamics: Watch fiscal policy developments and any debt ceiling negotiations for volatility signals.
Bottom Line
The Dow Jones Industrial Average in 2026 is navigating a complex environment of value rotation, geopolitical risk, and macro uncertainty. The technical picture is constructive above $49,000 and analyst consensus leans bullish toward $55,000 to $64,000 by year-end but risks are real and the bearish scenario to $42,000 cannot be dismissed. For investors who value stability, dividends, and blue-chip quality over high-growth exposure, the DJIA remains a core portfolio anchor worth monitoring closely through the second half of 2026.
This article is for informational purposes only and does not constitute investment advice. All forecasts cited are from third-party sources and reflect their own methodologies. Consult a licensed financial advisor before making investment decisions.