Ticker: SPY | Exchange: NYSE Arca | Issuer: State Street Global Advisors | Rating: CORE HOLD (Long-Term) Current Price (June 2026): ~$756 | AUM: ~$683 billion | Expense Ratio: 0.0945% | Dividend Yield: ~1.2%
Executive Summary
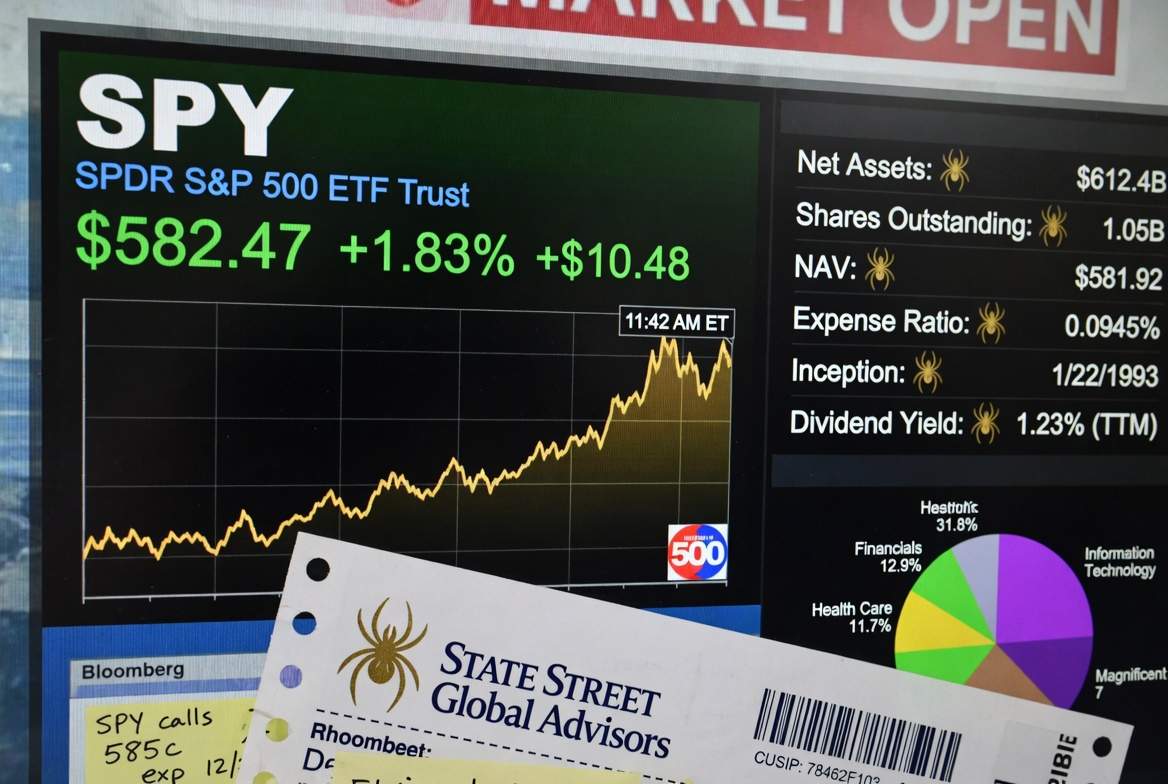
Few financial instruments have shaped modern investing more profoundly than the SPDR S&P 500 ETF Trust, known by its ticker SPY. Launched on January 22, 1993, it was the very first exchange-traded fund listed in the United States, and it has since grown into the world’s most traded equity vehicle. For investors seeking broad exposure to large-cap U.S. equities, SPY remains the definitive benchmark product, even as lower-cost alternatives have emerged.
This report provides a comprehensive analysis of SPY from an equity research perspective. Specifically, it covers the fund’s structure, historical performance, current holdings, competitive positioning versus IVV and VOO, key risks, and a structured scenario framework for the S&P 500 through 2030. Whether you are a long-term buy-and-hold investor, an active trader using SPY for tactical allocation, or an institution managing hedges and options exposure, understanding this fund’s mechanics is essential before sizing any position.
Core thesis in one sentence: SPY is the world’s most liquid equity instrument, providing unmatched access to 500 large-cap U.S. companies, but long-term investors should carefully weigh its structural limitations against lower-cost alternatives such as VOO and IVV before committing capital.
1. Fund Structure and History
From Pioneer to Institution
SPY was created by State Street Global Advisors and launched in January 1993, making it over 33 years old as of this writing. At the time of its launch, the concept of packaging the S&P 500 index into a single, exchange-tradeable security was genuinely revolutionary. Institutional investors immediately adopted it as a tool for rapid market exposure, and over the following decade, retail investors discovered its value as a simple, diversified building block.
Legal Structure: The Unit Investment Trust
One of the most consequential and often overlooked features of SPY is its legal structure. Unlike modern competitors such as Vanguard’s VOO and BlackRock’s IVV, SPY operates as a Unit Investment Trust (UIT) rather than an open-end fund. This distinction matters substantially for long-term investors.
As a UIT, SPY cannot reinvest dividends between quarterly distribution dates. Consequently, incoming dividends sit in a non-interest-bearing cash account until the fund distributes them to shareholders. Furthermore, SPY cannot engage in securities lending, which is a common practice among open-end ETFs that generates incremental income to offset operating costs. As a result of these structural constraints, SPY carries a small but persistent performance drag relative to VOO and IVV over long time horizons.
Why SPY Remains Dominant Despite Higher Costs
Given these structural disadvantages, one might reasonably ask why SPY still manages approximately $683 billion in assets. The answer lies almost entirely in liquidity. SPY trades approximately 10 times the daily dollar volume of VOO and IVV combined. Moreover, its options market is among the most liquid in the world, making it the indispensable instrument for institutional investors, hedge funds, and anyone running portfolio hedges or volatility strategies at scale. For a fund manager needing to enter or exit a $500 million position in minutes, the liquidity premium of SPY is not a luxury but a necessity.
2. What SPY Actually Owns
The S&P 500 Index
SPY seeks to replicate the price and yield performance of the S&P 500 Index by holding all 500 constituent stocks at their market-capitalization weights. As of June 2026, the fund holds 505 assets (some companies have multiple share classes represented), providing exposure to the full spectrum of U.S. large-cap equity.
Sector Allocation
The sector composition of SPY reflects the current dominance of technology in the U.S. economy. Technology alone represents approximately 34% of the fund, followed by Financial Services at roughly 12 to 13% and Communication Services at approximately 10 to 11%. Consequently, investors purchasing SPY as a “diversified” broad market fund are, in practice, making a significant implied bet on the continued performance of technology and AI-related sectors.
The full approximate sector breakdown as of 2026 is:
| Sector | Approximate Weight |
|---|---|
| Information Technology | ~34% |
| Financial Services | ~13% |
| Communication Services | ~11% |
| Healthcare | ~10% |
| Consumer Discretionary | ~9% |
| Industrials | ~8% |
| Consumer Staples | ~6% |
| Energy | ~3% |
| Materials | ~2% |
| Real Estate | ~2% |
| Utilities | ~2% |
Top Holdings
The fund’s concentration at the individual stock level is equally striking. The top 10 holdings account for approximately 38 to 39% of total assets. In other words, well over one-third of every dollar invested in SPY is exposed to just 10 companies. The top five holdings as of 2026 are:
| Rank | Company | Approximate Weight |
|---|---|---|
| 1 | NVIDIA Corporation | ~8% |
| 2 | Apple Inc. | ~6.5 to 7% |
| 3 | Microsoft Corporation | ~5% |
| 4 | Amazon.com Inc. | ~4% |
| 5 | Alphabet Inc. | ~3.5% |
Notably, NVIDIA has risen to the top position in the index, displacing Apple, as a direct consequence of the AI infrastructure boom. This structural shift means that SPY investors now have the largest single-stock exposure to the AI chip cycle of any mainstream index ETF. Furthermore, the combined weight of just these five companies exceeds 27% of the entire fund.
3. Historical Performance: The Long-Term Case for Passive Investing
Long-Run Return Data
SPY’s track record makes a compelling case for passive, buy-and-hold equity investing. Over the 30 years since its 1993 inception, the fund has delivered a compound annual return of approximately 10.32%, with a standard deviation of 15.33%. On a nominal basis, the total return since launch has been approximately 2,819%, equivalent to an annualized rate of 10.65%. Adjusted for inflation, the real annualized return since 1993 stands at approximately 7.87%.
In more practical terms, the specific return periods as of 2026 are as follows:
| Period | Total Return | CAGR |
|---|---|---|
| 1 Year (TTM) | ~28% | ~28% |
| 3 Year | N/A | ~21% |
| 5 Year | ~92% | ~13% |
| 10 Year | ~320% | ~11.4% |
| 15 Year | ~637% | N/A |
| 20 Year | ~761% | ~11.4% |
| 30 Year (since launch) | ~2,819% | ~10.6% |
| 30 Year (inflation-adjusted) | ~1,150% | ~7.87% |
The S&P 500’s 150-year historical average annual return, using a broader dataset including dividends and reinvestment, stands at approximately 9.4% in nominal terms and 6.98% adjusted for inflation. These figures provide the foundational long-term expectation for investors considering SPY as a core holding.
Recent Performance
In 2025, SPY delivered a total return of 17.72%. Year-to-date through June 2026, the fund is up approximately 10.35%, and the trailing 12-month return stands at approximately 28%. The fund reached an all-time high price of approximately $756 as of late May 2026. Additionally, SPY achieved record closes alongside the S&P 500 and Nasdaq in this period, reflecting continued strength in large-cap technology earnings.
Drawdowns and Volatility
Despite its strong long-term record, SPY is not without significant risk. Over its history, the fund suffered a maximum drawdown of approximately 50.8% during the 2008 to 2009 Global Financial Crisis, which required 53 months to fully recover. Similarly, the 2000 to 2002 dot-com crash produced severe losses concentrated in the technology sector, which at that time also represented an outsized share of the index. Investors must therefore approach SPY with a time horizon long enough to absorb multi-year drawdown periods.
4. SPY vs. VOO vs. IVV: The Critical Comparison
Why the Choice Matters
For most investors, the practical decision is not whether to own S&P 500 exposure, but which fund to use. SPY, Vanguard’s VOO, and BlackRock’s IVV all track the same index and deliver virtually identical sector and holdings exposure. Nevertheless, meaningful differences in structure, cost, and tax efficiency make the choice consequential over a multi-decade holding period.
Expense Ratio Comparison
The expense ratio gap is the most commonly cited difference. SPY charges 0.0945% annually, whereas both VOO and IVV charge just 0.03%. In percentage terms this seems trivial, but over 20 to 30 years on a large portfolio, the compounding effect of that 0.06% difference is material. On a $100,000 investment compounding at 10% annually over 30 years, the fee gap alone reduces terminal value by approximately $40,000 to $50,000.
Structural and Tax Efficiency Differences
As described earlier, SPY’s UIT structure prevents dividend reinvestment and securities lending. By contrast, VOO and IVV are open-end funds that reinvest dividends immediately, engage in securities lending for incremental income, and are generally more tax-efficient. As a result, for long-term, taxable-account investors, VOO and IVV have a measurable structural advantage over SPY.
Liquidity: Where SPY Wins Decisively
Despite higher costs, SPY has one clear and decisive advantage: liquidity. With average daily dollar volume exceeding $62 billion, SPY trades roughly 10 times the daily volume of VOO and IVV. Furthermore, SPY’s options market is the world’s most liquid for any single equity instrument. For institutional investors, hedge funds, and active traders using SPY for portfolio hedges, tactical allocation, or volatility strategies, this liquidity premium is non-negotiable. In short, SPY is optimized for trading; VOO and IVV are optimized for long-term compounding.
Summary Comparison Table
| Feature | SPY | VOO | IVV |
|---|---|---|---|
| Issuer | State Street | Vanguard | BlackRock |
| Expense Ratio | 0.0945% | 0.03% | 0.03% |
| AUM | ~$683B | ~$1.1T | ~$748B |
| Structure | Unit Investment Trust | Open-End Fund | Open-End Fund |
| Dividend Reinvestment | No | Yes | Yes |
| Securities Lending | No | Yes | Yes |
| Best For | Active traders, institutions | Long-term investors | Long-term investors |
| Daily Options Volume | Extremely high | Moderate | Moderate |
5. The S&P 500 Macroeconomic Context in 2026
Current Market Environment
As of June 2026, the S&P 500 is trading near record highs, having recovered strongly from the April 2026 correction driven by geopolitical tensions and tariff uncertainty. The index delivered a 10.35% year-to-date total return, building on 2025’s 17.72% gain. Goldman Sachs has reiterated its base-case year-end 2026 target of 7,600 for the index, representing approximately 13.5% above levels seen earlier in the year. Barclays has revised its full-year 2026 EPS forecast for the S&P 500 upward to $321, with FactSet projecting 13.2% year-over-year earnings growth.
The AI Earnings Engine
A central driver of the S&P 500’s elevated valuation is the AI infrastructure spending cycle. AI-driven earnings growth has disproportionately benefited the largest index components, particularly NVIDIA, Microsoft, Alphabet, Amazon, and Meta, which together represent more than 25% of SPY by weight. Consequently, SPY’s performance is increasingly correlated with AI capital expenditure trends. This is both an opportunity and a concentration risk that investors must understand explicitly.
Valuation Context
The S&P 500 currently trades at a premium to historical norms. While exact P/E ratios fluctuate, the index’s elevated valuation relative to its 150-year average implies that future returns are likely to be lower than the historical 10.6% nominal CAGR, absent a sustained earnings acceleration from AI productivity gains. Vanguard’s Economic and Market Outlook predicts 4 to 6% annual growth in U.S. equities over the next decade, explicitly citing high starting valuations as the primary headwind. By contrast, Fundstrat’s Tom Lee projects the S&P 500 could reach 15,000 by 2030, driven by 20% annual returns supported by 12 to 15% EPS growth and AI productivity tailwinds. Both views deserve consideration, as the range of credible outcomes is unusually wide.
6. S&P 500 and SPY Scenarios Through 2030
Methodology
The following analysis presents three structured scenarios for SPY’s value in 2030. These are analytical frameworks mapping assumptions to outcomes, not stock price predictions. All scenarios assume dividends are reinvested and use approximate current levels of roughly $756 as the starting point.
Key Macro Assumptions Common to All Scenarios
- U.S. GDP grows at a positive rate through 2030, avoiding a prolonged recession
- The Federal Reserve maintains a broadly neutral to accommodative monetary policy
- AI-related productivity gains contribute positively to corporate earnings in at least a moderate degree
- No catastrophic geopolitical disruption or structural breakdown in global trade
Scenario A: Bull Case: AI-Driven Earnings Acceleration
Assumptions:
- S&P 500 EPS grows at 12 to 15% annually through 2030, driven by AI productivity gains and continued tech sector dominance
- The market maintains a P/E of approximately 22 to 24x, consistent with a moderately elevated but sustainable multiple
- S&P 500 reaches approximately 12,000 to 15,000 by 2030, consistent with Tom Lee’s 15,000 target
- Implied annual return of approximately 12 to 15% including dividends
Implied SPY price in 2030: approximately $1,300 to $1,600 Implied total return from current levels: approximately 72 to 112%
This scenario requires sustained AI-driven earnings growth to justify current valuation levels, continued capital expenditure from hyperscalers, and a supportive macroeconomic backdrop without a significant recession.
Scenario B: Base Case: Moderate Growth with Multiple Compression
Assumptions:
- S&P 500 EPS grows at 7 to 10% annually, in line with the historical average during non-recessionary periods
- The P/E multiple gradually compresses from current elevated levels toward a more historically normal range of 18 to 20x
- S&P 500 reaches approximately 9,500 to 10,300 by 2030, consistent with most expert consensus forecasts
- Implied annual return of approximately 5 to 8% including dividends
Implied SPY price in 2030: approximately $990 to $1,100 Implied total return from current levels: approximately 31 to 46%
This base case aligns with LiteFinance’s consensus forecast of $9,522 to $10,319 for the S&P 500 by 2030 and reflects a realistic scenario in which AI benefits materialize but are offset by valuation normalization.
Scenario C: Bear Case: Recession or AI Disappointment
Assumptions:
- A recession occurs in 2027 to 2028, causing EPS to decline 15 to 25% before recovery
- AI productivity gains disappoint relative to current expectations, leading to reduced tech sector earnings
- The P/E multiple contracts sharply to 14 to 16x, reflecting a risk-off environment
- S&P 500 falls to approximately 5,400 to 6,300 in a correction phase before partial recovery by 2030
- Implied total return from current levels is near zero to modestly negative over the full period
Implied SPY price in 2030: approximately $560 to $660 Implied total return from current levels: approximately -13 to -7%
Goldman Sachs has outlined this bear case scenario explicitly, citing oil shocks and geopolitical escalation as potential triggers for S&P 500 levels as low as 5,400. Nevertheless, the bank considers this outcome unlikely given the resilience of corporate earnings observed so far in 2026.
Probability-Weighted Expected Return
Assigning rough probabilities of 30% to the bull case, 55% to the base case, and 15% to the bear case yields a probability-weighted expected annual return of approximately 7 to 8%. This is broadly consistent with the historical long-run average and confirms that SPY remains a reasonable core holding for long-term investors, though the upside appears more muted from current elevated valuations than it would from historical average entry points.
7. SPY as a Portfolio Building Block
For Long-Term Investors
SPY functions most effectively as a core equity allocation for investors with multi-decade time horizons. As a result of its full-replication strategy, it eliminates stock selection risk and manager underperformance risk simultaneously. Academic research consistently shows that the vast majority of actively managed funds underperform their benchmark over 15-year or longer periods. Consequently, holding SPY as a core position and accepting market returns is, counterintuitively, a strategy that outperforms most professional active managers over long horizons.
However, long-term investors should seriously consider VOO or IVV instead of SPY. The lower expense ratio, superior fund structure, and dividend reinvestment efficiency of those alternatives compound into materially better outcomes over 20 to 30-year periods. SPY’s liquidity premium is only valuable to investors who actually trade in and out of the position, which is precisely the behavior that tends to reduce long-term returns.
For Active Traders and Institutions
Conversely, for active traders, options strategists, and institutional investors, SPY is essentially irreplaceable. Its bid-ask spreads round to zero given its scale, and its options market provides the deepest liquidity pool available in any single equity product globally. Therefore, anyone running tactical equity exposure, delta hedging, or volatility strategies should use SPY rather than its lower-cost competitors.
Dollar-Cost Averaging Considerations
Dollar-cost averaging into SPY (or VOO/IVV) on a regular schedule is one of the most empirically validated long-term wealth building strategies available to retail investors. Moreover, regular contributions remove the behavioral risk of trying to time the market, which research consistently shows reduces rather than improves long-term returns. The S&P 500’s historical maximum drawdown of 50.8% is a reminder that bear markets will occur; however, each historical drawdown has eventually been fully recovered and surpassed by new highs.
8. Key Risks for SPY Investors
Concentration Risk
Despite holding 500 stocks, SPY carries meaningful concentration risk at both the sector and individual stock level. Information technology represents approximately 34% of the fund. Furthermore, just 10 companies account for nearly 39% of total assets. Investors seeking true diversification should consider complementing SPY with small-cap, international, or value-tilted funds to reduce this concentration.
Valuation Risk
The S&P 500 currently trades at a premium to historical P/E averages. As a result, starting valuation matters significantly for expected returns over the next decade. Investors purchasing SPY today at elevated valuations should temper their 10-year return expectations relative to the historical 10.6% nominal CAGR, which was achieved from a range of starting valuations including many lower entry points.
Geopolitical and Macro Risks
Trade policy uncertainty, Middle East geopolitical tensions, and the evolving U.S.-China technology conflict all pose risks to the earnings trajectory of SPY’s top holdings. In particular, companies such as NVIDIA, Apple, and Broadcom have significant exposure to China-related revenue risks that could materialize as headwinds. Additionally, any significant tightening in Federal Reserve policy or resurgence of inflation could compress the P/E multiple and reduce total returns.
Currency Risk for International Investors
For investors outside the United States, SPY carries implicit U.S. dollar exposure. Consequently, if the dollar weakens significantly against the investor’s home currency, dollar-denominated returns may be partially or fully eroded even if the underlying equity performance is strong. International investors should consider whether currency hedging is appropriate for their specific situation.
9. SPY and AI: The Index’s Evolving Composition
How AI Has Reshaped SPY
Perhaps the most significant structural change in SPY over the past three years is the extraordinary rise of AI-related companies within the index. NVIDIA’s ascent to the largest single holding, at approximately 8% of the fund, is the most visible manifestation of this shift. However, the AI theme permeates far more of the index than NVIDIA alone.
Microsoft, the second or third largest holding at approximately 5%, derives an increasing proportion of its revenue from Azure cloud AI services and its OpenAI partnership. Alphabet, at approximately 3.5%, is deploying AI across Google Search, Cloud, and its DeepMind division. Amazon, at approximately 4%, is scaling AWS AI services and its Trainium custom silicon program. Meta, at approximately 2.6%, is investing aggressively in AI recommendation systems and Llama open-source models.
In aggregate, therefore, the top five holdings of SPY are simultaneously the five companies most deeply exposed to the AI infrastructure buildout. This creates a compounding relationship between AI capital expenditure cycles and SPY’s performance that did not exist to this degree five years ago.
Implications for Investors
The elevated AI exposure within SPY has two distinct implications. On one hand, it means that SPY has materially outperformed its historical average in recent years as AI earnings inflected sharply upward. On the other hand, it also means that any reversal in AI sentiment, a slowdown in hyperscaler capital expenditure, or a significant disappointment in AI monetization would disproportionately impact SPY relative to the broad index it nominally represents. Investors should therefore assess their existing technology exposure before adding SPY to ensure they are not inadvertently doubling down on a single theme.
10. Wall Street Consensus and Current Analyst Views
2026 S&P 500 Targets
Wall Street analyst consensus for the S&P 500 as of mid-2026 remains broadly constructive. Goldman Sachs has reiterated its base-case year-end target of 7,600 for 2026, anchored by projected EPS of $309 per share for 2026 and $342 for 2027. Barclays has revised its full-year EPS forecast upward to $321, reflecting better-than-expected corporate earnings through Q1 2026.
Additionally, Goldman Sachs has described the current phase as a “marathon broadening,” suggesting that the next leg of market gains may come from cyclicals and industrials catching up to the mega-cap technology leaders, rather than continued narrowing concentration. If this rotation materializes, it could improve SPY’s risk-adjusted performance by reducing its dependence on any single sector.
2030 Targets
Looking further ahead, expert forecasts for the S&P 500 by 2030 range widely, reflecting genuine uncertainty about the pace of AI monetization and macroeconomic conditions. Most institutions project the index reaching 9,500 to 10,300 by 2030. More bullish forecasters, notably Fundstrat’s Tom Lee, target 15,000. In contrast, Vanguard’s more conservative outlook implies approximately 4 to 6% annual returns from current levels, citing elevated starting valuations as the primary constraint.
11. Key Risks Summary
| Risk Factor | Probability | Potential Impact | Mitigation |
|---|---|---|---|
| AI spending cycle reversal | Low to Medium | High | Broad index diversification limits single-stock damage |
| Recession in 2027 to 2028 | Medium | High | Long time horizon allows drawdown recovery |
| Valuation compression from rate rises | Medium | Medium | Dollar-cost averaging reduces timing risk |
| Tech sector concentration | High (ongoing) | Medium | Complement with value and international funds |
| Geopolitical disruption | Low to Medium | Medium | Global diversification; long-term horizon |
| Currency risk (non-USD investors) | Medium | Medium | Consider hedged ETF alternatives |
| Structural drag vs. VOO/IVV | High (ongoing) | Low to Medium | Switch to VOO or IVV for long-term accounts |
12. Investment Conclusion
Who Should Own SPY
SPY is the right instrument for a clearly defined investor profile. Active traders, institutional investors, options strategists, and anyone who needs to enter or exit large positions quickly should hold SPY due to its unparalleled liquidity. For these investors, the higher expense ratio is a justified cost of access to the world’s most liquid equity market.
Who Should Consider Alternatives
By contrast, long-term buy-and-hold investors building retirement or wealth accumulation portfolios would generally be better served by VOO or IVV. Both offer the same S&P 500 exposure at one-third the cost, with superior fund structure and dividend reinvestment efficiency. Over 20 to 30 years, the compounding benefit of lower fees and better structure is not trivial; it amounts to several percentage points of additional wealth.
The Core Long-Term Case
Regardless of which specific instrument is chosen, the case for S&P 500 index exposure as a core portfolio holding remains strong. The index’s 30-year nominal CAGR of approximately 10.6% has rewarded patient investors who stayed the course through multiple recessions, bear markets, and geopolitical crises. Furthermore, the AI-driven earnings cycle currently underway provides a credible fundamental basis for continued above-average returns in the near to medium term, even if long-run expectations should be moderated from recent elevated levels.
Verdict for SPY specifically: CORE HOLD for traders and institutions; consider switching to VOO or IVV for pure long-term buy-and-hold accounts. For anyone already holding SPY in a taxable account with large embedded gains, the tax cost of switching to a lower-fee alternative may outweigh the structural benefit, and holding SPY to term remains entirely reasonable.
Appendix: SPY Key Fund Metrics at a Glance
| Metric | Value (June 2026) |
|---|---|
| Fund Name | SPDR S&P 500 ETF Trust |
| Ticker | SPY |
| Issuer | State Street Global Advisors |
| Inception Date | January 22, 1993 |
| Current Price | ~$756 |
| Assets Under Management | ~$683 billion |
| Expense Ratio | 0.0945% |
| Legal Structure | Unit Investment Trust |
| Number of Holdings | ~505 |
| Dividend Yield | ~1.2% |
| Dividend Frequency | Quarterly |
| Top Holding | NVIDIA (~8%) |
| Top Sector | Information Technology (~34%) |
| 20-Year CAGR | ~11.4% |
| 30-Year CAGR | ~10.6% |
| 30-Year Real (Inflation-Adjusted) CAGR | ~7.87% |
| Maximum Historical Drawdown | ~50.8% |
| Drawdown Recovery Time (Worst Case) | 53 months |
| Beta | ~1.0 (by definition) |
| YTD Return (2026) | ~10.35% |
| TTM Return | ~28% |
This article is for informational and educational purposes only and does not constitute financial advice. Investing in ETFs and index funds involves risk, including the possible loss of principal. Past performance is not indicative of future results. Always conduct your own due diligence or consult a qualified financial adviser before making investment decisions. Investments-Research.com has no position in any securities mentioned at the time of publication.