Most people assume financial independence requires either a high income, a lucky break, or millions sitting in the bank already. The math behind SCHD tells a different story. A single $50,000 investment, left untouched with dividends reinvested, can compound into a full-time income stream over 30 years. Not because of hype or speculation, but because of three forces working together quietly: a 10.6% average annual dividend growth rate, a 0.06% expense ratio that leaves nearly every dollar in your account, and the compounding effect that rewards patience above everything else.
This article breaks down the strategy, the verified numbers, the conservative case, the historical case, and exactly what this means in practice for investors at different stages.
Why SCHD Is the Engine Behind This Strategy
SCHD is the Schwab U.S. Dividend Equity ETF, managed by Charles Schwab Asset Management. It tracks the Dow Jones U.S. Dividend 100 Index and holds approximately 100 to 103 stocks selected through one of the most demanding quality screens in the ETF universe.
To qualify for SCHD, a company must have paid dividends for at least 10 consecutive years. That threshold alone eliminates the vast majority of US-listed stocks. What survives that filter is then ranked on four factors simultaneously: dividend yield, five-year dividend growth rate, return on equity, and cash flow to total debt ratio. The result is a concentrated portfolio of businesses that do not just pay dividends but have demonstrated the financial durability to sustain and grow them across multiple economic cycles.
SCHD’s 10-year dividend CAGR stands at 11.5%, and the dividend has nearly tripled in a decade, from $0.35 per share in 2015 to $1.05 per share in 2025. There has never been a dividend cut or freeze since the fund launched in October 2011. That includes 2020, when the broader market collapsed and many companies suspended payouts entirely. SCHD’s underlying holdings kept raising their dividends.
The fund boasts a 10-year dividend growth rate of 10.72%, with a compound annual growth rate of 10.99% from 2012 to 2025.
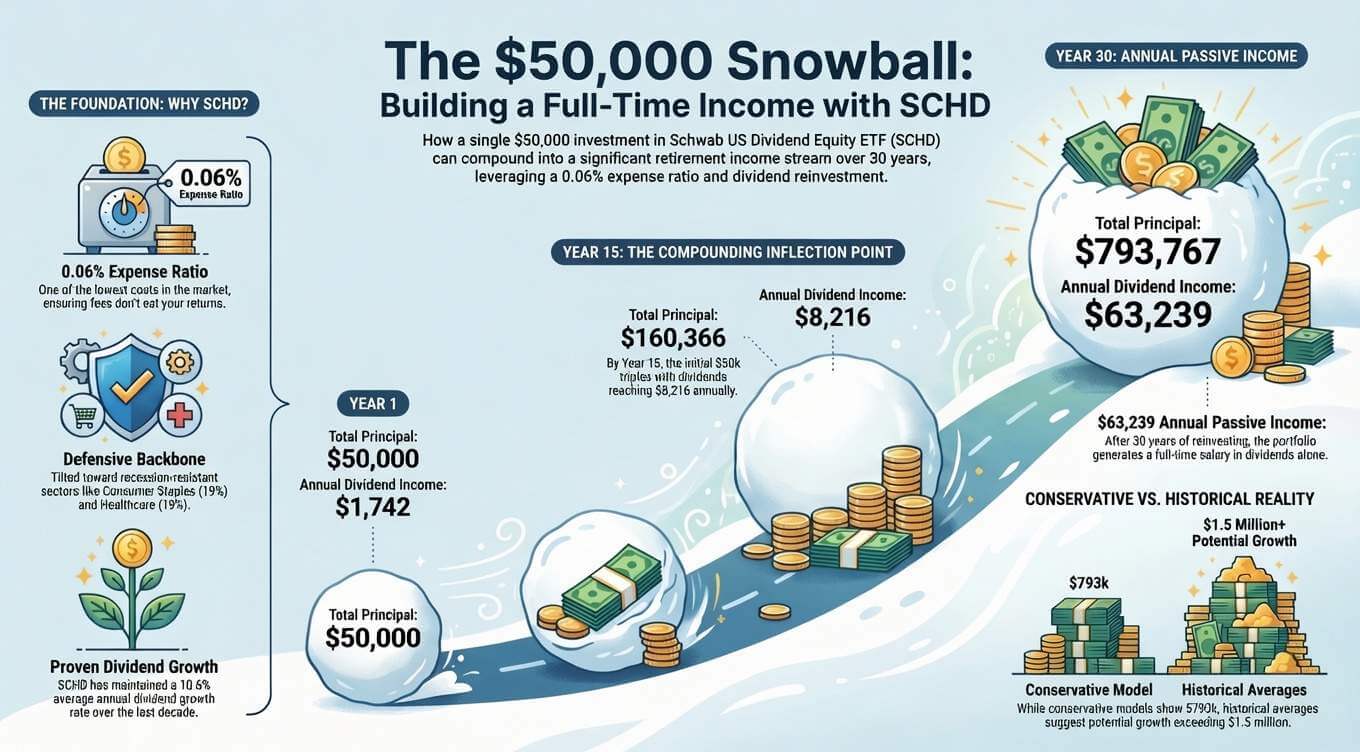
The other number that matters for long-term compounding is the expense ratio: 0.06% per year. At that level, fees are effectively irrelevant. On a $50,000 investment, you pay $30 per year in management costs. Every other dollar stays invested, compounding continuously without friction. Over 30 years, the difference between a 0.06% expense ratio and a 1.0% expense ratio on the same investment is hundreds of thousands of dollars. This is not a minor detail.
The Defensive Backbone: Why the Portfolio Composition Matters
SCHD is not a technology ETF. It does not chase the fastest-growing companies in the market. What it holds instead is a deliberate collection of businesses in sectors that generate reliable cash flows regardless of what the economy is doing.
After the 2026 annual reconstitution, the current sector breakdown is:
| Sector | Approximate Weight |
|---|---|
| Consumer Staples | 18.7% |
| Healthcare | 18.5% |
| Information Technology | 15.3% |
| Energy | 15.2% |
| Industrials | 10.6% |
| Financials | 8.4% |
| Other | 13.3% |
The top current holdings include Texas Instruments, Qualcomm, UnitedHealth Group, Coca-Cola, Chevron, Merck, ConocoPhillips, Verizon, PepsiCo, and Procter & Gamble. These are not exciting names. That is the point. Coca-Cola does not miss a dividend because a competitor releases a new AI model. Procter & Gamble does not cut its payout because of a tech sector rotation. The defensive composition of this portfolio is what allows the dividend to grow consistently through bear markets, recessions, and volatility spikes.
This defensiveness also shows up in the fund’s beta of 0.53. SCHD has historically moved at roughly half the volatility of the broader market. In 2022, one of the worst years for equities in recent memory, SCHD fell just 3.23% while the S&P 500 fell over 18%.
The Compounding Snowball: Conservative Model Over 30 Years
The projections below use deliberately conservative assumptions. The dividend growth rate used is 8% per year, which is meaningfully below SCHD’s verified 10-year historical average of 10.6% to 11.5%. The annual price appreciation used is 5.12%, also well below the fund’s 15-year actual average of 13.53%. A 15% dividend tax rate is applied throughout. This conservative framing is intentional. An investment plan built on the pessimistic case has a much larger margin of safety than one built on historical averages.
| Milestone | Total Principal | Annual Dividend Income |
|---|---|---|
| Year 1 | $50,000 | $1,742 |
| Year 5 | $71,248 | $3,020 |
| Year 10 | $101,555 | $5,284 |
| Year 15 | $160,366 | $8,266 |
| Year 20 | $253,247 | $14,480 |
| Year 25 | $448,803 | $25,330 |
| Year 30 | $793,767 | $63,239 |
Starting income of $1,742 in Year 1 is genuinely unimpressive. That is by design. The strategy does not reward impatience and it is not supposed to. The mechanism at work here is that every dividend received is immediately reinvested into new shares, which in turn generate their own dividends, which are also reinvested. The snowball starts small and builds slowly. Then, around Year 15, the compounding inflection point arrives. By Year 15 on this conservative model, the $50,000 has grown to $160,366 in principal and is generating $8,266 per year in dividend income. By Year 30, the same initial investment sits at $793,767 in principal and throws off $63,239 per year in dividends alone, more than the median US household income, without touching the principal.
The yield on cost at Year 30 on the original $50,000 investment exceeds 126% annually. Every year, the portfolio pays you more than twice what you originally put in.
The Historical Reality Case: What 10.6% Growth Actually Produces
The conservative model above uses 8% dividend growth. SCHD’s actual 10-year average is 10.6% to 11.5% depending on the measurement period. Plugging in the historical average rather than the discounted assumption produces a fundamentally different outcome.
| Scenario | Year 30 Principal | Year 30 Annual Income | Yield on Cost |
|---|---|---|---|
| Conservative (8% DGR, 5.12% price growth) | $793,767 | $63,239 | 126% |
| Historical Average (10.6% DGR) | $1,500,000+ | $253,000+ | 405%+ |
At the historical rate, the portfolio grows to over $1.5 million and produces annual dividend income exceeding $253,000. The yield on cost on the original $50,000 reaches approximately 405%, meaning the portfolio pays out more than four times the original investment every single year in dividends.
These are large numbers and they deserve healthy skepticism. Past dividend growth rates are not a guarantee of future performance. SCHD could reconstitute into weaker holdings. The slowest growth year on record was 2023 at just 3.8%, though the dividend still grew rather than being cut. The historical average includes exceptional years like 2019 at 19.8% and 2020 at 17.7%. Future decades may not replicate those peaks.
The honest framing is this: the conservative model shows what happens if SCHD performs significantly below its historical average for 30 years straight. Even that scenario produces a full-time income by Year 30. The historical model shows what actually happened to investors who held SCHD since its early years. The reality for someone starting today will land somewhere between those two numbers.
The Roth IRA Supercharger
Tax treatment is the most underused variable in long-term dividend investing. The models above assume a 15% dividend tax rate, which applies to qualified dividends for most middle-income investors in a standard taxable brokerage account. Moving the same SCHD position into a Roth IRA changes the calculation significantly.
In a Roth IRA, qualified withdrawals in retirement are completely tax-free. Dividends reinvested inside the account grow without any annual tax drag. On the conservative 8% dividend growth model with a $50,000 starting investment, the difference between a 15% tax rate and 0% inside a Roth produces approximately $185,000 in additional wealth at Year 30. The annual dividend income at Year 30 in the Roth scenario reaches approximately $78,629 versus $63,239 in the taxable account.
For investors who cannot deploy $50,000 immediately, the math still works with a smaller start. A $10,000 initial investment combined with $300 per month in additional contributions produces an estimated $60,371 in annual dividend income at Year 30 on the conservative model. Consistency replaces the lump sum. The compounding mechanism is identical.
What This Looks Like at Different Starting Points
| Strategy | Year 30 Annual Income (Conservative) |
|---|---|
| $50,000 lump sum, taxable account | $63,239 |
| $50,000 lump sum, Roth IRA (0% tax) | $78,629 |
| $10,000 start + $300/month, taxable | $60,371 |
| $50,000 lump sum, historical 10.6% DGR | $253,000+ |
The core insight across all four scenarios is the same: the starting amount matters less than the consistency and the time horizon. Investors who begin with less but contribute regularly arrive at a similar destination.
The Income Timeline in Plain Terms
Year 1 produces $1,742. That is $145 per month in dividends. It does not replace anything yet. It compounds.
By Year 15, the portfolio generates $8,266 per year, or roughly $688 per month. That covers a car payment, a utility bill, or a meaningful portion of regular monthly expenses.
By Year 30, at $63,239 per year on the conservative model, the portfolio is producing $5,270 per month in dividend income alone. The principal of $793,767 remains intact and continues compounding. You have not sold a single share to generate that income.
This is the structural difference between a dividend compounding strategy and a capital depletion strategy in retirement. A traditional portfolio that generates income by selling shares shrinks over time. A dividend compounding portfolio, if built on a fund like SCHD with a consistent growth track record, generates increasing income while the principal itself continues to grow.
The Honest Caveats
This strategy requires patience that most investors find genuinely difficult. Year 1 income of $1,742 on a $50,000 investment looks underwhelming. Most people who start this approach quit before Year 5, when the snowball is still small and the temptation to chase higher-yielding alternatives is strongest.
SCHD’s annual reconstitution means the portfolio you own today is not identical to the portfolio you owned five years ago. Holdings are added and removed. Sector weights shift. The March 2026 reconstitution was one of the more significant in recent memory, bringing in UnitedHealth, Qualcomm, and Procter & Gamble while reducing energy exposure. Future reconstitutions could introduce holdings that dilute the historical quality standard.
The 10-year Treasury currently yields approximately 4.5%. SCHD’s current yield of 3.27% does not beat that on a raw income basis today. The case for SCHD over a Treasury is dividend growth, equity appreciation, and inflation protection over time, not immediate yield competition. Investors who need maximum income today may find higher initial yields elsewhere. Investors building toward future income have a compelling case for SCHD.
SCHD has a dividend yield of 3.27% and paid $1.06 per share in the past year, with the dividend paid every three months.
SCHD Performance in Context: 2026 Update
The total return CAGR for SCHD over the past 12 months is 27.80%. The 3-year average growth rate is 15.30% and the 5-year CAGR is 8.71%. The 15-year average annual return is 13.53%. Year to date in 2026, SCHD is up approximately 20%, recovering meaningfully from its 2023 to 2025 underperformance during the growth-led market rally. AUM has grown to approximately $93 billion, and the fund attracted approximately $711 million in net inflows in a single week in May 2026.
The fund’s Q2 2026 ex-dividend date is June 24, with payment on June 29. Investors who own shares before the close of June 23 receive the next quarterly distribution.
Final Thoughts
The SCHD dividend snowball strategy is not a get-rich-quick idea. It is a get-rich-slowly framework built on verified, repeatable mechanics: quality screening, low fees, dividend reinvestment, and time. The conservative model produces a full-time income in 30 years even if SCHD performs well below its historical average. The historical model produces generational wealth on a $50,000 starting investment.
The first year is the hardest, not because the math is difficult, but because $1,742 in annual income feels like nothing. Every serious long-term investor in this strategy has sat through that first year. The ones who kept going are now in Year 10, Year 15, Year 20, watching the snowball reach sizes that were hard to visualise at the start.
The math is not magic. It is patience compounded by a quality fund that has never cut its dividend in 15 years of operation. That combination, given enough time, does the work.
Disclaimer: This article is published by Investments Research and is intended for informational purposes only. It does not constitute investment advice or a recommendation to buy, sell, or hold SCHD or any other security. All projections are models based on historical data and are not guaranteed outcomes. Data sourced from Mezzi, DRIPCalc, DripWealth, Stock Analysis, FinanceCharts, and Charles Schwab Asset Management as of June 2026. Past performance is not indicative of future results. Consult a qualified financial advisor before making any investment decision.