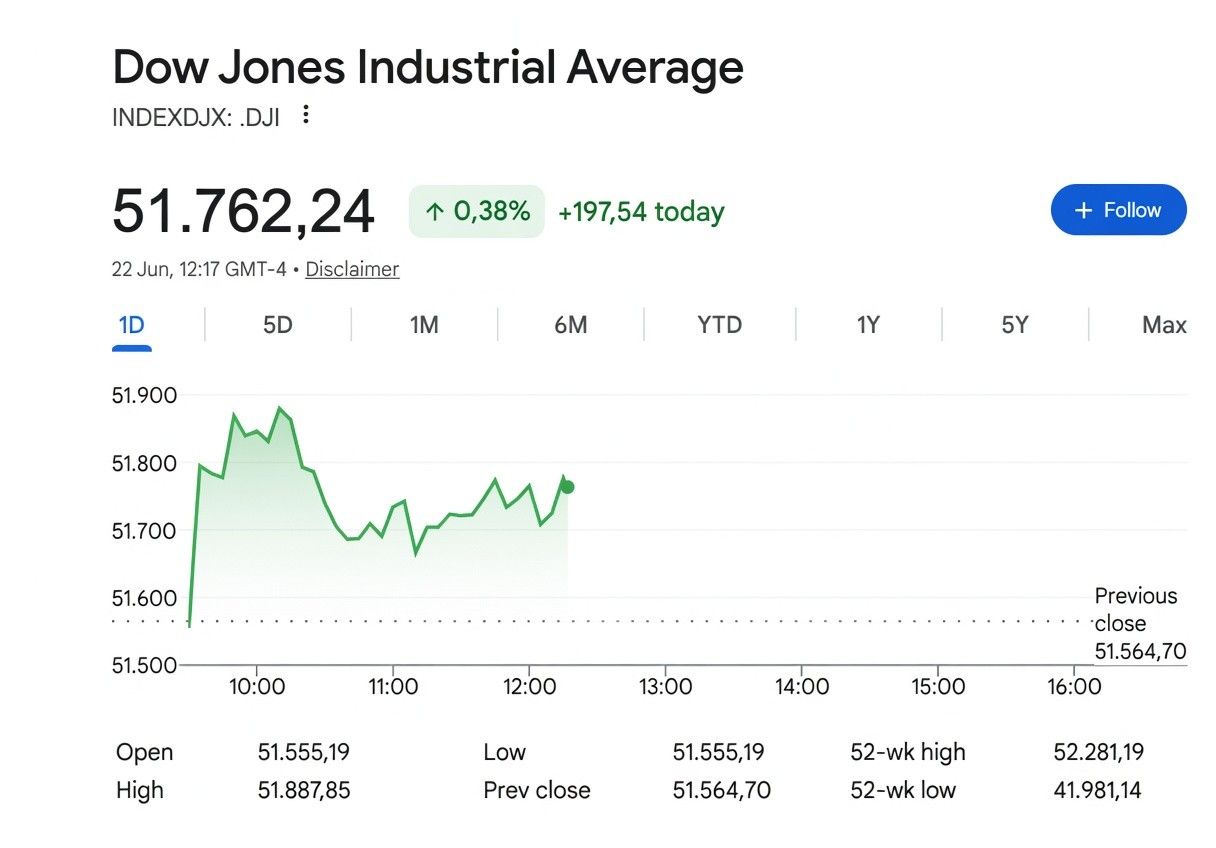
The Dow Jones Industrial Average has crossed a series of historic milestones in 2026, briefly touching an all-time intraday high above 52,000 and surpassing the 50,000 level for the first time in February. Yet the index has navigated significant turbulence along the way, from a Middle East conflict that rattled markets in Q1 to a hawkish Federal Reserve shift in June. For investors tracking the oldest and most recognisable benchmark in U.S. equities, here is a clear breakdown of where the Dow stands, what is driving it, and what comes next.
What Is the Dow Jones Industrial Average?
The Dow Jones Industrial Average is a price-weighted index of 30 prominent companies listed on U.S. stock exchanges. First published in 1896 by Charles Dow, it is one of the oldest equity indices in the world and remains the most widely quoted barometer of U.S. stock market health. Unlike the S&P 500 or Nasdaq Composite, which weight constituents by market capitalisation, the Dow weights each component by its share price. This means a higher-priced stock exerts more influence on the index regardless of the company’s overall size.
That methodology has a well-known limitation. A company with a high share price but a relatively modest market cap can move the index more than a far larger company trading at a lower price. Goldman Sachs, for instance, has historically been the largest Dow component by price weighting despite being significantly smaller by market cap than Apple. Critics argue this makes the Dow a less accurate representation of overall market performance than the S&P 500 or Russell 3000. Over the long run, however, the indices have performed with near-identical annualised returns: between January 1980 and November 2023, the Dow returned 8.90% annualised versus 8.91% for the S&P 500.
2026 Performance: Record Highs and Sharp Pullbacks
The Dow crossed 50,000 for the first time on February 6, 2026, a milestone that marked a continuation of the multi-year bull market that began recovering from the tariff-driven selloffs of early 2025. The 52-week range through mid-June 2026 has been approximately 41,981 to 52,281, reflecting a gain of roughly 22% over the prior year. As of June 18, the index closed at 51,564.70.
| Metric | Value |
|---|---|
| 52-week low | ~41,981 |
| 52-week high | ~52,281 |
| June 18, 2026 close | 51,564.70 |
| 12-month return | ~22.2% |
| February 2026 milestone | First close above 50,000 |
The Dow’s path in 2026 has not been linear. The index fell sharply in Q1 alongside broader markets as the U.S.-Iran conflict pushed energy prices higher and increased risk aversion. A recovery followed in April as peace negotiations gained traction. June brought fresh volatility: on June 5, the Dow lost 695 points, or 1.35%, closing at 50,866.78, as a stronger-than-expected May jobs report raised concerns about a Federal Reserve rate hike. The index rebounded in the following sessions, touching fresh highs near the 52,000 level before the Fed’s June meeting introduced a new source of uncertainty.
The Dow vs. Nasdaq: A Diverging Story in 2026
One of the more interesting dynamics in 2026 has been the periodic divergence between the Dow and the Nasdaq Composite. Because the Dow is heavily weighted toward industrials, financials, healthcare, and consumer staples, it has at times moved in the opposite direction from the tech-heavy Nasdaq during sector rotation episodes.
On June 16, 2026, for instance, the Dow gained 0.72% and reached a record high while the Nasdaq fell 1.03% as investors rotated away from AI and semiconductor stocks ahead of the Federal Reserve decision. That pattern reflects the Dow’s role as a defensive anchor in portfolios during periods when technology stocks are under pressure. When the AI trade rebounds, the Nasdaq typically leads, while the Dow provides relative stability.
Federal Reserve Policy: The Dominant Variable
The Federal Reserve’s June 2026 meeting, the first chaired by Kevin Warsh following his Senate confirmation, resulted in a unanimous vote to hold the benchmark overnight borrowing rate steady in the 3.5% to 3.75% range. However, the meeting’s statement and dot plot signalled a more hawkish posture than markets had priced in. Nine of the 18 participating policymakers indicated they expected at least one rate hike before the end of 2026. Warsh himself declined to add his projection, consistent with his public criticism of the dot plot as a communication tool.
The Dow fell more than 500 points on the day of the Fed announcement as bond yields surged. The 10-year Treasury yield, which directly influences borrowing costs across the economy, has been a consistent headwind for equities throughout 2026. The Fed’s preferred inflation measure, the PCE price index, is due for release later this week, and analysts expect a firm print given data from the Producer Price Index components that map to PCE. A hotter-than-expected reading could further shift expectations toward a rate hike later in the year.
Geopolitical Backdrop: U.S.-Iran Ceasefire Negotiations
The U.S.-Iran conflict has been a recurring driver of Dow volatility throughout 2026. The two countries signed a memorandum of understanding in June brokered by Pakistan, with Qatar and Pakistan confirming agreement on a roadmap toward a final deal within 60 days. The memorandum included a framework to reopen the Strait of Hormuz and set the stage for talks on Iran’s nuclear programme and broader regional security.
Markets have responded positively to each sign of de-escalation and negatively to setbacks. Oil prices fell sharply in May as ceasefire expectations improved, with Brent crude declining significantly from earlier highs tied to Middle East supply concerns. Lower energy prices feed directly through to consumer inflation data, giving the Federal Reserve more room to keep rates on hold. As of this week, however, President Trump threatened fresh strikes if Hezbollah continues attacks on Israel, and Iranian media reported that Tehran temporarily suspended negotiations before sources familiar with the talks said they were continuing.
Key Dow Components to Watch
Several Dow components have been notable in 2026. Intel received a significant catalyst on June 18 when President Trump announced via social media that Apple would design and build chips in the United States using Intel’s manufacturing capacity, sending Intel shares sharply higher. AbbVie agreed to acquire Apogee Therapeutics in a $10.9 billion cash deal, adding support to the healthcare weighting in the index. Goldman Sachs, historically the highest-priced component and therefore the largest contributor to Dow point movements, has continued to benefit from strong capital markets activity.
Consumer staples names have been relative underperformers across the market in 2026, as the AI trade drew institutional capital toward technology and growth sectors. This has created a rotation dynamic within the Dow, where its more defensive components have lagged while industrials and financials have provided support.
Outlook for H2 2026
The macroeconomic calendar for the remainder of June and into Q3 will be closely watched by Dow investors. This week brings the S&P Global Flash PMIs for June on Tuesday, May new home sales on Wednesday, and May PCE inflation data on Thursday alongside personal income and spending. Friday brings May durable goods orders, a final Q1 GDP estimate, and revised University of Michigan consumer sentiment and inflation expectations. Each of these readings could move markets depending on whether the data reinforces or pushes back against rate hike expectations.
The broader outlook for the Dow in H2 2026 hinges on three variables: the direction of Federal Reserve policy, the trajectory of U.S.-Iran negotiations and their effect on energy prices, and the durability of corporate earnings growth. Q1 2026 earnings were exceptionally strong by historical standards, with blended year-over-year growth of 28.6% for S&P 500 companies. Whether that pace continues into Q2 will become clear in late July when major companies begin reporting. For the Dow specifically, the performance of its financial and industrial heavyweights will be as important as the AI-driven tech names that dominate Nasdaq coverage.
The Dow remains a useful barometer of the broader U.S. economy precisely because its 30 components span the full range of American industry. Its relative outperformance versus the Nasdaq during technology selloffs, and its milestone crossing of 50,000 in early 2026, reflect an economy that has demonstrated resilience even as rate and geopolitical pressures have created uncertainty. The second half of 2026 will test that resilience further.
Disclaimer: This article is for informational and educational purposes only. It does not constitute investment advice or a recommendation to buy or sell any security. Past performance is not indicative of future results. Always conduct your own research or consult a qualified financial advisor before making investment decisions.