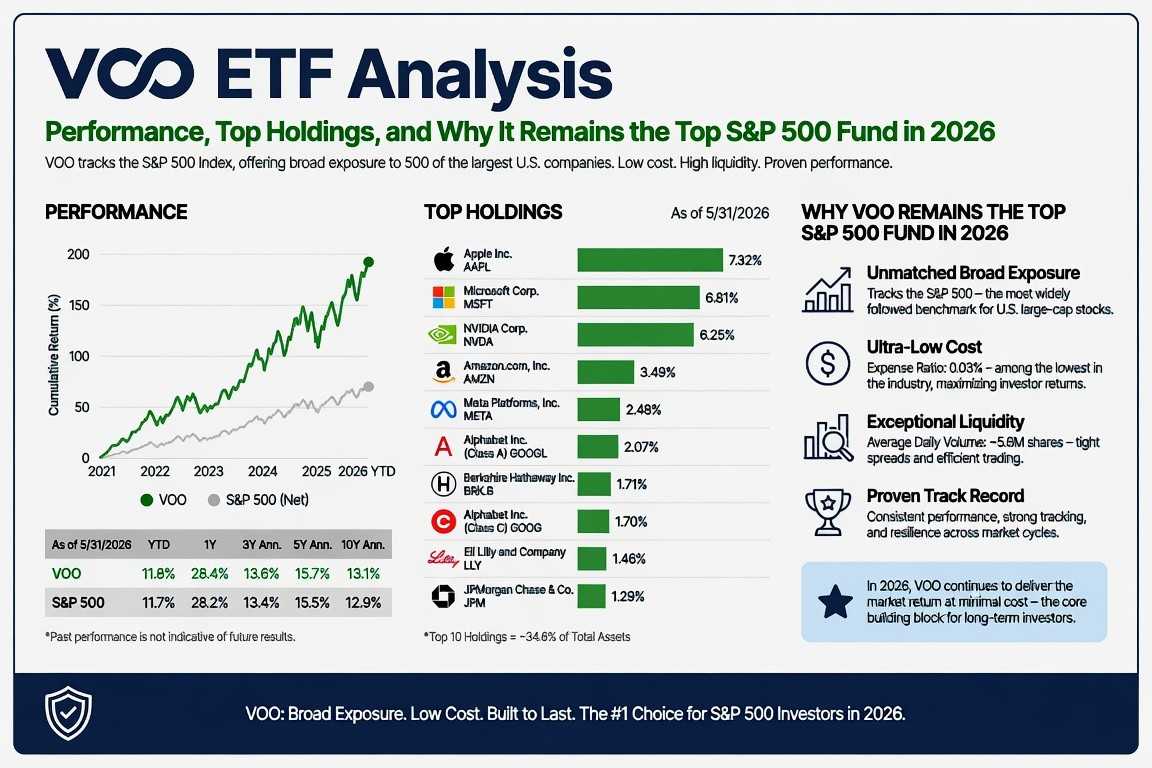
Vanguard S&P 500 ETF (VOO) is the largest ETF in the world by total fund assets, holding over $1.7 trillion across its share classes as of May 2026. It launched in September 2010 and has since become the default vehicle for long-term retail investors seeking low-cost exposure to the U.S. equity market. The fund tracks the S&P 500 Index, holding all 505 of its constituent stocks in proportion to their index weights, and charges an expense ratio of just 0.03% per year.
This analysis covers VOO’s current price and performance, top holdings, sector allocation, fund structure, the case for and against it, and how it compares to its closest competitors, SPY and IVV.
VOO Key Facts at a Glance
| Metric | Data |
|---|---|
| Ticker | VOO |
| Issuer | Vanguard |
| Inception Date | September 7, 2010 |
| Exchange | NYSE Arca |
| Price (Jun 24, 2026) | ~$674–$679 |
| 52-Week Range | $558.34 – $699.15 |
| Expense Ratio | 0.03% |
| Total Net Assets (fund level) | $1,701.5 billion |
| ETF Net Assets | $995.5 billion |
| Holdings | 505 |
| Dividend Yield | ~1.05% |
| YTD Return (NAV) | 8.20% |
| 1-Year Return | ~29.74% |
| 3-Year Annualized Return | ~23.57% |
| 5-Year Annualized Return | ~14.11% |
| Turnover Rate | 2.40% |
VOO Price Performance in 2026
VOO entered 2026 recovering from the volatility that marked late 2024 and early 2025. By mid-June 2026, the fund was trading in the $674–$679 range, roughly 3% below its 52-week high of $699.15 and about 22% above its 52-week low of $558.34. Year-to-date, VOO has returned 8.20% on a NAV basis, outperforming its Morningstar Large Blend category average of 5.14%.
The one-year return of approximately 29.74% reflects a strong recovery in U.S. large-cap equities. Over three years, the annualized return of 23.57% exceeds the category average of 19.34%, a pattern consistent with VOO’s structural cost advantage over actively managed alternatives. The fund’s P/E ratio sits at approximately 28.6 at current prices, reflecting the premium the market continues to assign to the S&P 500’s earnings base.
Top Holdings
As of mid-June 2026, VOO’s top holdings mirror the S&P 500’s concentration in mega-cap technology. The ten largest positions account for roughly 39% of the fund’s total assets.
| Company | Ticker | Weight (%) |
|---|---|---|
| NVIDIA Corp | NVDA | 7.89% |
| Apple Inc | AAPL | 7.05% |
| Microsoft Corp | MSFT | 5.14% |
| Amazon.com | AMZN | ~3.55% |
| Alphabet (combined) | GOOGL/GOOG | ~3.2% |
| Meta Platforms | META | ~2.8% |
| Berkshire Hathaway | BRK.B | ~1.7% |
| Broadcom Inc | AVGO | ~1.7% |
| Tesla Inc | TSLA | ~1.4% |
| JPMorgan Chase | JPM | ~1.3% |
NVIDIA’s position at the top of the index reflects the semiconductor giant’s extraordinary run driven by AI infrastructure demand. That a single chip company now represents nearly 8% of the fund is a notable structural point for investors who consider VOO to be a broadly diversified holding. The technology sector as a whole accounts for approximately 36.9% of the fund, a concentration level that has drawn increasing scrutiny in 2026.
Sector Allocation
VOO’s sector weights track the S&P 500 exactly. Technology dominates, followed by financials and healthcare. Consumer discretionary and industrials round out the top five by weight.
| Sector | Approximate Weight |
|---|---|
| Information Technology | ~36.9% |
| Financials | ~13.5% |
| Health Care | ~11.2% |
| Consumer Discretionary | ~10.5% |
| Industrials | ~8.3% |
| Communication Services | ~8.7% |
| Consumer Staples | ~5.5% |
| Energy | ~3.3% |
| Real Estate | ~2.2% |
| Materials | ~2.1% |
| Utilities | ~2.4% |
Fund Structure: Why It Matters for Long-Term Returns
VOO is structured as an open-end fund, unlike SPY which operates under a Unit Investment Trust (UIT) structure dating from 1993. That distinction has a practical consequence. Under UIT rules, SPY cannot reinvest dividends received from its underlying holdings. Instead, those dividends accumulate in a non-interest-bearing cash account until the quarterly distribution date. During that interval, the cash earns nothing, creating a small but compounding drag on long-run performance.
VOO is not subject to this constraint. Dividends are reinvested immediately, and the fund can also participate in securities lending, generating incremental income that helps offset even the fund’s already minimal operating costs. Over a 30-year investment horizon, the combination of lower fees and structural reinvestment efficiency adds up to a measurable advantage. On a $10,000 investment compounding at 7% annually over 30 years, the 0.065 percentage point fee gap between VOO and SPY amounts to roughly $1,400 in lost returns.
Vanguard’s ownership model reinforces this structural alignment. The firm is owned by the funds it manages, which are in turn owned by the fund shareholders. There are no external shareholders whose profit interests must be balanced against those of investors. This model has historically produced a consistent institutional bias toward lower fees rather than margin expansion.
VOO vs SPY vs IVV: The Comparison That Matters
The three largest S&P 500 ETFs collectively hold close to $2.7 trillion in assets. They track the same index, hold the same underlying companies, and produce nearly identical gross returns. The differences come from cost, structure, and intended use.
| Feature | VOO | SPY | IVV |
|---|---|---|---|
| Issuer | Vanguard | State Street | BlackRock iShares |
| Inception | 2010 | 1993 | 2000 |
| Expense Ratio | 0.03% | 0.0945% | 0.03% |
| Fund Structure | Open-end ETF | Unit Investment Trust | Open-end ETF |
| Dividend Reinvestment | Yes | No (quarterly cash drag) | Yes |
| AUM (ETF level) | ~$995B | ~$641B | ~$686B |
| Daily Volume | High | Highest (institutional) | High |
| Options Market | Good | Deepest globally | Good |
| Best For | Long-term buy-and-hold | Active traders, institutions | Long-term buy-and-hold |
SPY’s higher expense ratio is not an oversight. Its primary user base consists of institutional traders, hedge funds, and options market participants for whom a few basis points is irrelevant compared to the value of executing large orders quickly in the world’s deepest ETF options market. For a retail investor buying and holding for decades, that liquidity premium is not useful and the extra cost is simply a drag.
Between VOO and IVV, the choice involves no meaningful performance difference. Both charge 0.03%, both reinvest dividends, both track the same index with near-perfect accuracy. The primary consideration is platform. Investors within the Vanguard ecosystem will naturally hold VOO. Investors on platforms where BlackRock’s iShares products integrate more cleanly may prefer IVV, which also provides a near-identical substitute for tax-loss harvesting purposes.
The Concentration Question
The most substantive analytical concern around VOO in mid-2026 is sector concentration. With information technology accounting for roughly 37% of the fund and the top ten holdings making up close to 39% of assets, an investor buying VOO is implicitly making a large bet on continued AI-era technology dominance. NVIDIA alone at 7.89% represents a weight that would have seemed implausible in an S&P 500 index fund five years ago.
This is not a flaw in VOO specifically. It reflects the S&P 500’s own market-cap weighting methodology, which allocates more to companies as they grow larger. VOO tracks the index exactly. The question for investors is whether the S&P 500’s current composition aligns with their risk preferences. For those who want the same underlying companies but without the size-driven concentration, RSP, the Invesco S&P 500 Equal Weight ETF, offers identical constituent exposure with each company weighted equally at approximately 0.2%. That design produces meaningfully different sector exposures and historically diverges from cap-weighted returns during rotation periods.
Dividends
VOO distributes dividends quarterly. The trailing dividend yield sits at approximately 1.05% as of May 2026, based on Vanguard’s official data. On a 30-day SEC yield basis, that figure was 1.00%. This is not an income-oriented product. The yield is a byproduct of the underlying index’s dividend-paying companies rather than a design objective. Investors seeking meaningful income distribution alongside equity exposure should look at dedicated dividend ETFs such as SCHD.
For U.S. investors in tax-advantaged accounts such as IRAs or 401(k)s, the dividend yield compounds without tax friction. For taxable account holders, dividends are subject to qualified dividend tax rates in most cases, though this varies by holding period and individual tax situation.
Who VOO Is Suited For
VOO is optimized for investors who want broad U.S. large-cap equity exposure at the lowest sustainable cost, intend to hold for extended periods, and do not require the options market depth or intraday trading liquidity of SPY. Morningstar awards it a Gold Medalist rating, reflecting both the quality of the index it tracks and its operational cost efficiency. Since inception in 2010, the fund has delivered an annualized return of approximately 14.8%.
It is less suited to investors who need high dividend income, want exposure beyond U.S. large caps, or are specifically managing around the current technology concentration in the S&P 500. For broader U.S. market exposure including mid and small caps, VTI, Vanguard’s total market ETF, offers an alternative at the same 0.03% expense ratio with a slightly different composition that has historically produced returns within a few basis points of VOO annually.
Bottom Line
VOO is the world’s largest ETF, carrying the lowest available expense ratio for an S&P 500 fund, an open-end structure that avoids dividend drag, and a decade-plus track record of near-perfect index replication. For a long-term buy-and-hold investor seeking straightforward U.S. equity exposure, the case for VOO is structural and durable. The main risk is not unique to VOO itself but to the S&P 500’s current composition, where one sector accounts for more than a third of the fund and a handful of technology companies exert outsized influence on daily price movement.
This article is for informational purposes only and does not constitute investment advice. Past performance is not indicative of future results. Always conduct your own research before making investment decisions.