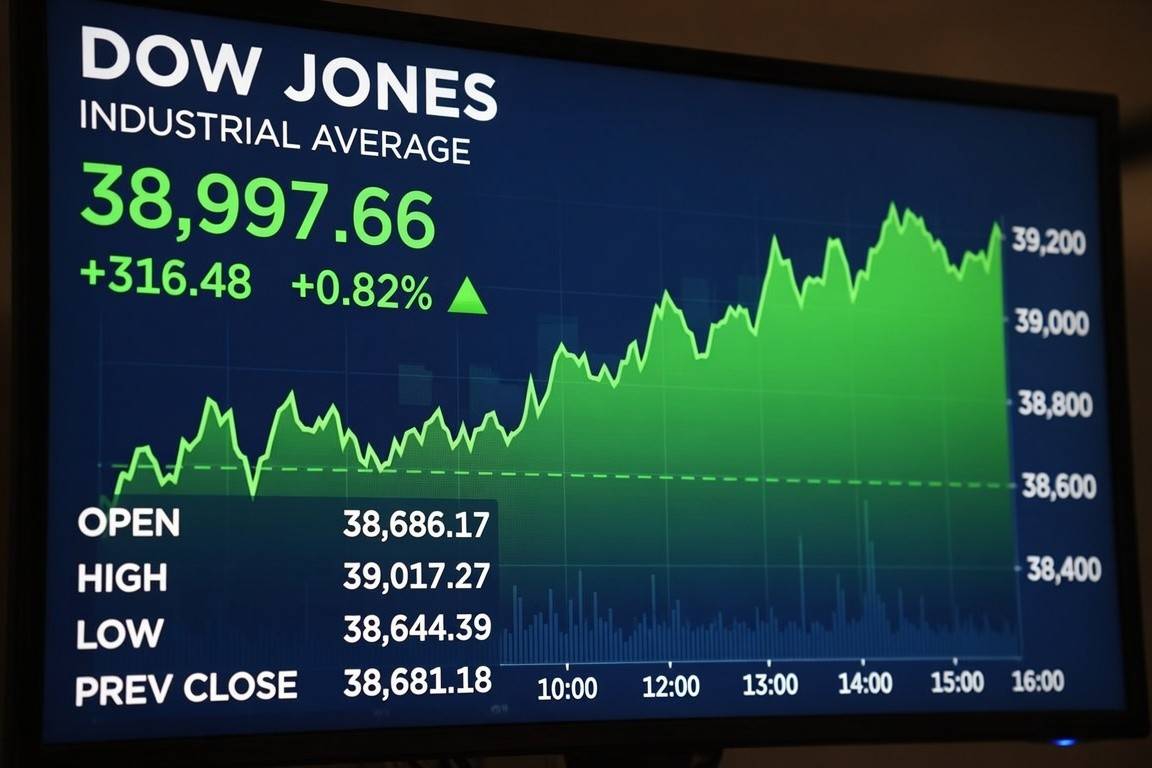
From Record 53,000 Breakout, Key Support Levels in Focus
The Dow Jones Industrial Average is consolidating below its recent all-time high after briefly breaking above the psychologically significant 53,000 level for the first time in the index’s history. Wednesday’s session brought the blue-chip benchmark down more than 600 points intraday, pulling the index back toward a cluster of technical support levels that traders are now watching closely for signs of whether the broader uptrend remains intact.
Record Breakout Followed by Sharp Pullback
The Dow closed above 53,000 for the first time on Monday, July 6, extending a bullish run that has carried the index up more than 20% over the trailing twelve months. Year-to-date, the benchmark is tracking a gain of roughly 8%, with a notably strong three-month advance near 14.7% as cyclical and industrial names reasserted leadership. That breakout, however, proved short-lived. By midweek, the index had reversed sharply, giving back a large chunk of its recent gains and trading back down into the low 52,000s.
Momentum indicators had already been flashing caution ahead of the reversal. The Relative Strength Index was approaching overbought territory following the run to new highs, and several technical desks had flagged the potential for a short-term pullback or period of consolidation even as the longer-term trend structure remained constructive.
Key Support and Resistance Levels to Watch
Technical analysts are pointing to a layered support structure beneath current levels. Immediate support sits in the 52,000 to 52,200 zone, an area buyers have defended on several occasions in recent sessions to preserve a pattern of higher lows. Below that, a firmer floor is identified in the 51,876 to 51,900 range, where accumulated volume has previously acted as a cushion for the index.
A more significant support band lies further down, between roughly 50,290 and 50,860, with deeper structural levels near 49,000 marking the next major line of defense should the current pullback extend. On the upside, resistance is clustered in the 52,350 to 52,450 area, followed by the recent record high near 53,289. A confirmed breakout above that zone would likely reopen the path toward the next major technical target in the 54,500 to 55,000 region.
Moving Averages and Momentum Signals
The Dow continues to trade comfortably above its 50-day and 200-day moving averages, a configuration that has historically supported a bullish medium-term bias, with both averages currently sloping upward and the shorter-term average positioned above the longer-term one. The MACD indicator has also produced a buy signal on the three-month timeframe, though short-term daily readings have turned more mixed following the midweek selloff, with some models now flagging a sell signal on the fastest timeframes even as the weekly and monthly picture stays constructive.
Volume trends are worth monitoring as well. Recent sessions have shown declining volume even as prices pushed to new highs, a divergence that technicians often view as an early warning that upward momentum could be losing some conviction in the near term.
Volatility Ticks Higher
The CBOE Volatility Index, a widely followed gauge of expected market turbulence, jumped nearly 16% during the pullback, reflecting a rapid repricing of near-term risk after weeks of relatively contained volatility. A rising VIX alongside a pullback in the Dow is a pattern traders typically watch for confirmation of whether a correction is broadening or remains a short-lived, technical retracement within a larger uptrend.
Longer-Term Outlook
Despite the near-term turbulence, institutional price targets for the Dow remain constructive into year-end, with consensus estimates clustered between 52,000 and 54,000 for the close of 2026. Longer-range forecasts extending into 2027 place the index considerably higher, though such projections carry substantial uncertainty and should be treated as directional rather than precise.
For traders, the current setup keeps the focus squarely on whether the 52,000 support zone holds. A successful defense of that level would keep the sequence of higher lows intact and support the case for another attempt at the 53,000 to 53,300 resistance band. A decisive break below it, on the other hand, would shift the near-term bias toward the deeper support cluster in the 50,300 to 50,900 range.
This article is for informational purposes only and does not constitute investment advice. Trading in financial instruments and indices carries risk, and readers should conduct their own research before making trading decisions.