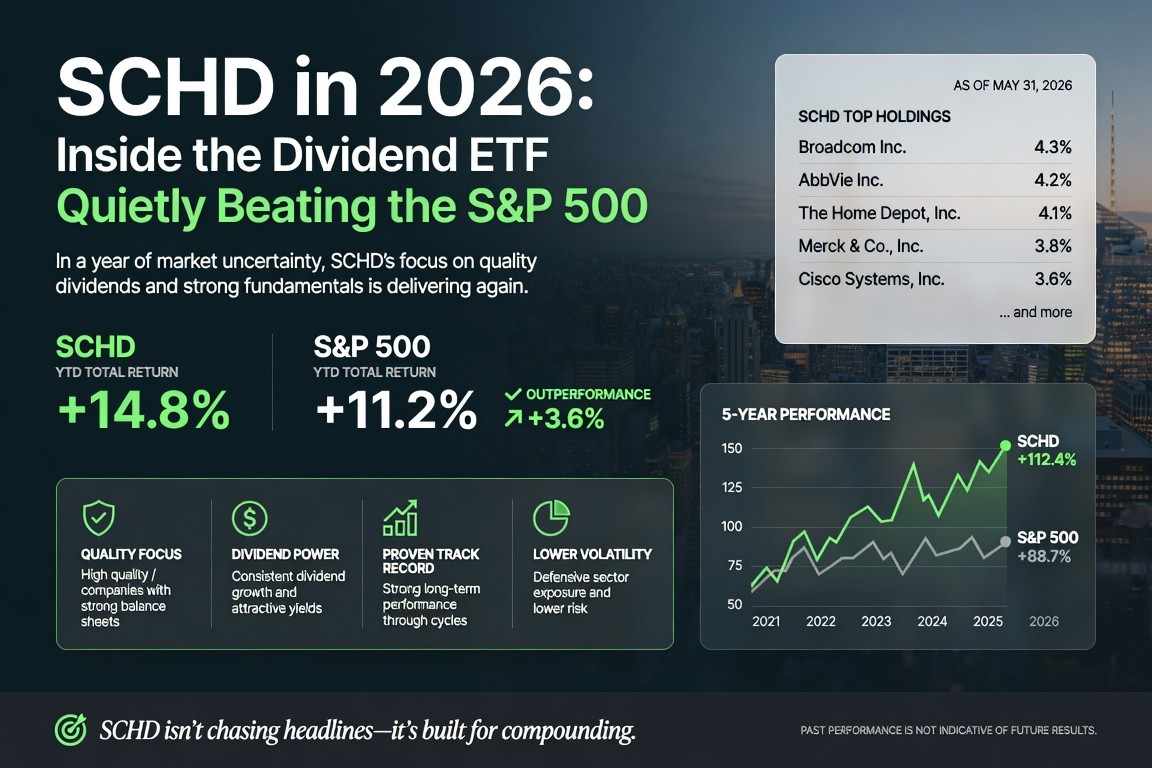
The Schwab U.S. Dividend Equity ETF (SCHD) is trading near $32.60, sitting close to its 52-week high of $32.92 and a long way clear of its 52-week low of $26.21. After years of lagging the mega-cap tech rally, the fund has quietly turned into one of the stronger stories of 2026, up roughly 12.8% year to date against a Morningstar Large Value category average gain of just 1.54%. For an ETF often dismissed as a slow, boring income vehicle, that gap is hard to ignore.
Current Price Action and Trading Levels
SCHD has spent recent sessions consolidating in the low $32 range after pushing to fresh highs earlier in the year. Trading volume has run below its 21-day average of roughly 21 million shares in several recent sessions, suggesting the move higher has cooled rather than reversed. The fund carries a market capitalization near $98 billion, making it one of the largest dividend-focused ETFs in the United States. Furthermore, the premium to net asset value has stayed minimal, typically within a few basis points, which indicates that authorized participants are keeping the share price tightly aligned with the underlying portfolio.
| Metric | Value |
|---|---|
| Current Price | ~$32.60 |
| 52-Week High | $32.92 |
| 52-Week Low | $26.21 |
| Dividend Yield (TTM) | ~3.2% to 3.4% |
| Expense Ratio | 0.06% |
| Assets Under Management | ~$98 billion |
| Number of Holdings | 102 |
| Top 10 Concentration | ~42% |
| YTD Return | ~12.8% |
The Dividend Story: What Income Investors Are Actually Getting
SCHD’s most recent quarterly distribution came in at $0.2525 per share, with an ex-dividend date of June 24, 2026 and a payment date of June 29, 2026. Consequently, the trailing twelve month payout stands near $1.05 per share, translating into a yield of roughly 3.2% to 3.4% depending on the exact price used in the calculation. That figure is meaningfully higher than the S&P 500’s yield, often cited as more than three times as generous. The one year dividend growth rate sits around 5.4%, which is a moderation from the double-digit growth rates the fund posted in earlier years, but it still outpaces inflation comfortably.
The next ex-dividend date is projected to fall between September 21 and September 25, 2026, with the payout estimated in the range of $0.2182 to $0.2604. Investors relying on SCHD for income should note the fund pays quarterly rather than monthly, which matters for anyone building a cash flow ladder across multiple holdings.
Why SCHD Has Outperformed in 2026
SCHD tracks the Dow Jones U.S. Dividend 100 Index, which screens for companies with at least a 10 year history of consistent dividend payments and then ranks them using fundamental metrics including cash flow to debt, return on equity, dividend yield, and dividend growth rate. Notably, the index excludes REITs entirely and caps individual holdings at 4% of the portfolio, with sector exposure capped at 25%. The portfolio rebalances quarterly, while the full holdings list is reviewed annually.
This structure has worked in SCHD’s favor as market leadership has rotated away from the AI-driven mega-cap names that dominated returns for much of the past several years. As tech valuations became stretched, capital rotated toward quality value names with strong balance sheets and consistent payout histories, which is precisely the profile SCHD is built to capture. Reports indicate the fund pulled in more than $18 billion in net inflows over the trailing six months, a sign that institutional allocators are treating this rotation as more than a short-term trade.
The Concentration Risk Worth Watching
SCHD’s top 10 holdings make up close to 42% of total assets, which is a meaningful concentration for a fund often marketed as a diversified income play. That said, the individual position cap of 4% means no single stock can dominate returns the way a handful of names dominate cap-weighted growth indices. Still, this concentration is a double-edged sword. It has amplified SCHD’s recent outperformance as value and dividend names have led the market, but it would work in reverse just as quickly if a handful of the fund’s largest holdings stumble.
The Key Risk: A Return to Tech Leadership
The single biggest risk to SCHD’s current run is a resumption of mega-cap tech leadership. The fund holds essentially no exposure to the AI infrastructure names that powered the broader market’s gains since 2020, and analysts have flagged this as the ETF’s clearest structural vulnerability. If inflation cools further and growth expectations firm up, capital could rotate back toward higher-growth technology names, which would likely cause SCHD to underperform the S&P 500 again, consistent with the pattern seen for much of the prior cycle.
Interest rate policy remains another swing factor. A dividend-heavy portfolio like SCHD’s tends to benefit when rates stay elevated for longer, since the yield advantage over cash and bonds becomes more attractive. Conversely, a faster than expected pace of rate cuts could reduce the relative appeal of dividend equities versus growth stocks, even if it would be broadly supportive for equity markets overall.
Historical Return Context
| Period | Approximate Return |
|---|---|
| Since Inception (2011) CAGR | ~13.3% |
| Year to Date 2026 | ~12.8% |
| Dividends’ Share of Total Return | ~38% |
Over its full history since 2011, SCHD has compounded at an annualized rate near 13.3%, with dividends contributing close to 38% of the total return. That split underscores why SCHD tends to appeal to investors focused on total return through reinvested income rather than pure price appreciation.
Where SCHD Fits in a Portfolio
SCHD is frequently compared against broader market funds such as VOO and growth-tilted alternatives such as QQQ, as well as direct dividend peers like VIG. Its combination of a 0.06% expense ratio, above-market yield, and quality screening process has made it a common core holding for investors building income focused portfolios, though it is rarely recommended as a sole holding given its lack of technology exposure and value tilt.
This article is for informational purposes only and does not constitute financial, investment, or tax advice. Past performance is not indicative of future results. Readers should conduct their own research or consult a licensed financial advisor before making any investment decisions.