Two tickers. One question investors keep asking in 2026: should I be in the boring, reliable S&P 500 machine, or is that fat 8.9% yield from the Eaton Vance closed-end fund actually worth chasing? The answer depends entirely on what you are trying to accomplish with your money, and the comparison only makes sense once you understand that EVV and VOO are not really competing products. They are built for fundamentally different jobs.
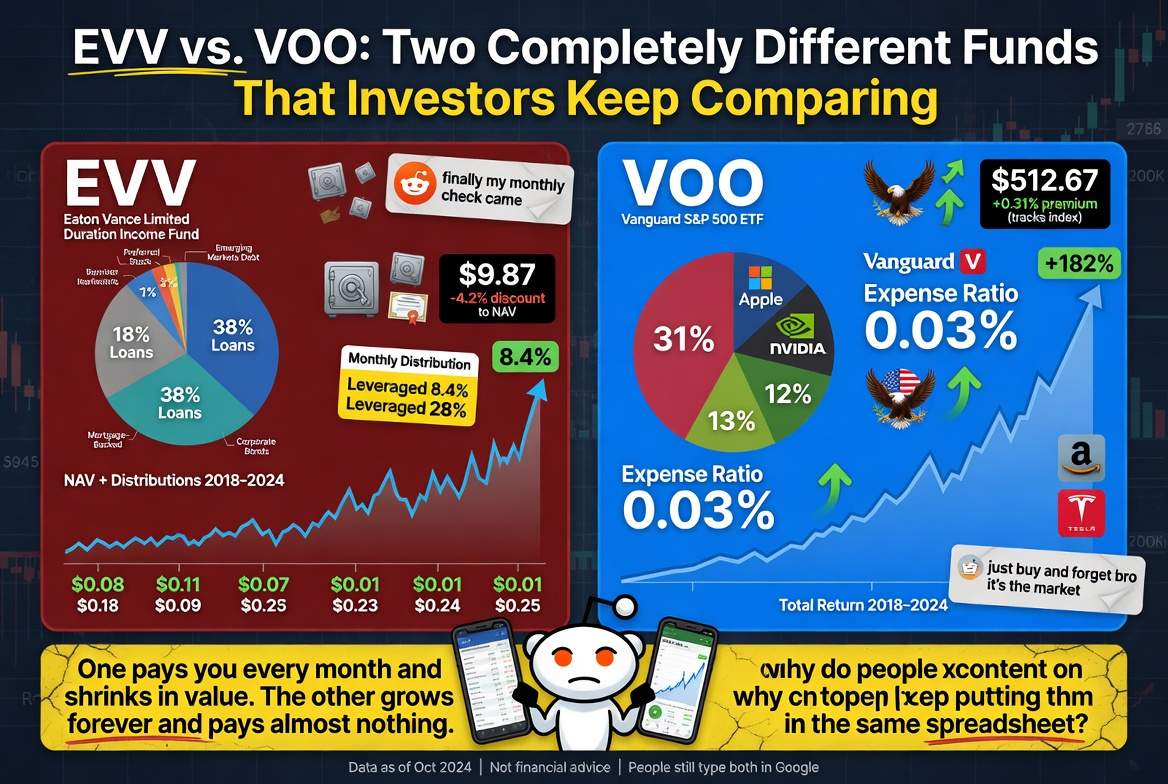
VOO, the Vanguard S&P 500 ETF, is currently trading at approximately $698 per share (as of June 2026), has $927.8 billion in net assets, and has returned 27.24% over the trailing 12 months. EVV, the Eaton Vance Limited Duration Income Fund, is a closed-end fund listed on NYSE American, carries a market cap of roughly $1.09 billion, yields approximately 8.9% at current prices, and trades at a 6.62% discount to its net asset value. These two vehicles share almost nothing in common except that both appear in brokerage accounts and both distribute cash to shareholders.
So why do investors compare them? Because the real question behind the comparison is one of strategy: growth versus income, equity versus fixed income, simplicity versus complexity.
Why the EVV vs. VOO Question Is the Wrong One, and the Right One
Most investors who find themselves weighing EVV against VOO are actually wrestling with a deeper portfolio decision. Specifically, they are asking whether to prioritize current income or long-term capital appreciation, and whether the income premium offered by a leveraged closed-end fund justifies the added complexity and risk.
The Search for Yield Is Driving the Conversation
In a market where VOO yields roughly 1.07% (as of June 2026) and high-yield savings accounts have been compressing alongside rate expectations, income-oriented investors are naturally drawn to anything offering 8% or more in distributions. EVV has become a recurring name in that search, partly because of its long track record and partly because the Eaton Vance brand carries credibility in the fixed income world.
Furthermore, retail investors have increasingly come to view closed-end fund discounts as an opportunity rather than a warning sign. When EVV trades at a 6.62% discount to NAV, some investors interpret that as buying $1.00 of assets for $0.93. Consequently, the appeal extends beyond the yield alone.
However, this framing misses important structural differences. VOO and EVV do not compete for the same role in a portfolio. Understanding each fund on its own terms is the only useful way to evaluate them.
VOO: The Benchmark Itself
Vanguard launched VOO in September 2010, and the fund has since grown into one of the largest investment vehicles on earth. With $927.8 billion in net assets and a total combined strategy AUM (including related share classes) of $1.6 trillion as of April 2026, VOO is effectively the S&P 500 index in ETF form.
What VOO Actually Does
The fund holds 505 U.S. large-cap stocks, replicating the S&P 500 index with a 2.40% annual turnover rate. Its expense ratio is 0.03%, making it one of the cheapest investment products in existence. Distributions are paid quarterly, and the trailing 12-month dividend yield stands at approximately 1.09% (as of April 2026). The P/E ratio is 21.96 as of current trading.
VOO’s year-to-date return through May 29, 2026 stands at 11.26% at market price, building on a 27.24% trailing 12-month gain. Moreover, the fund’s top holdings include Nvidia, Apple, Microsoft, Amazon, and Alphabet, meaning technology exposure is substantial. That concentration has been a tailwind in recent years, though it also introduces sector-specific risk.
The Structural Advantage
The key structural advantage of VOO is its size and liquidity. With $927.8 billion in net assets, bid-ask spreads are extraordinarily tight, making large trades frictionless. Additionally, the open-end ETF structure means that the fund’s market price almost never deviates meaningfully from its NAV. Consequently, investors pay close to fair value at all times, unlike closed-end fund structures where discounts and premiums can create significant pricing noise.
For long-term investors, VOO essentially delivers one thing: the return of the U.S. large-cap equity market, at near-zero cost. That simplicity is not a weakness.
| VOO Key Metrics (as of June 2026) | Value |
|---|---|
| Current Price | ~$698.79 |
| Net Assets (VOO share class) | $927.8B |
| YTD Return (market price) | 11.26% |
| Trailing 12-Month Return | 27.24% |
| Dividend Yield | 1.07% to 1.09% |
| Expense Ratio | 0.03% |
| P/E Ratio (trailing) | 21.96 |
| Number of Holdings | 505 |
| Inception Date | September 2010 |
EVV: A Closed-End Fund With a Very Different Mandate
EVV is not an ETF. That distinction matters enormously and is frequently overlooked by investors discovering the fund for the first time.
Structure and Objective
The Eaton Vance Limited Duration Income Fund is a closed-end fund, meaning it issued a fixed number of common shares at inception and does not continuously create or redeem shares the way an ETF does. As a result, EVV’s market price can and does trade at a meaningful discount or premium to the actual value of its underlying holdings. Currently, that discount sits at approximately 6.62% (as of the period ended March 31, 2026).
The fund’s primary objective is high current income. As a secondary goal, it seeks modest capital appreciation. Under normal market conditions, EVV maintains an average portfolio duration of no more than five years, including the effect of leverage. That limited-duration design is specifically intended to reduce sensitivity to interest rate moves, making the fund more stable than a traditional long-duration bond fund when rates are rising.
What EVV Holds and How It Generates That 8.9% Yield
EVV invests across several fixed income categories: senior secured floating-rate loans, collateralized loan obligations (CLOs), agency and non-agency mortgage-backed securities, and high-yield corporate bonds rated below investment grade. The average credit quality of the portfolio sits at BBB/BBB- (as of recent filings), and the average duration is approximately 3.47 years.
Notably, the fund uses significant leverage to amplify income. As of recent data, leverage accounts for approximately 39.1% of total fund assets, deployed through a combination of Auction Preferred Shares, borrowings, and reverse repurchase agreements. That leverage is the primary reason EVV can distribute approximately 8.9% annually while its underlying assets yield considerably less.
For the 12-month period ended March 31, 2026, EVV returned 6.30% at NAV, outperforming the Bloomberg U.S. Aggregate Bond Index return of 4.35% and the blended benchmark return of 5.97%. During that period, the fund paid $0.88 per share in total distributions. According to the fund’s own reporting, leverage was a meaningful contributor to outperformance during the period because underlying holdings generally posted positive returns.
The Discount as Opportunity, and as Warning
The 6.62% discount to NAV is a recurring feature of EVV’s history rather than a temporary anomaly. Closed-end funds often trade at persistent discounts, particularly in fixed income categories, because investors price in factors like leverage risk, distribution sustainability, and manager discretion. Consequently, while a discount can represent an entry opportunity if the discount narrows over time, it can also widen further, compressing returns even when underlying holdings perform well.
Furthermore, analysts have flagged a specific concern about EVV’s distribution sustainability: net investment income alone does not fully cover the fund’s distributions. The shortfall is made up through return of capital or realized gains, which can erode NAV over time if not replaced by appreciation in the underlying portfolio.
| EVV Key Metrics (as of June 2026) | Value |
|---|---|
| Fund Type | Closed-End Fund (not an ETF) |
| Exchange | NYSE American |
| Market Cap | ~$1.09B |
| Distribution Yield (market price) | ~8.9% |
| NAV Distribution Rate | 8.61% |
| Market Price Discount to NAV | (6.62)% |
| 12-Month NAV Return (to 3/31/2026) | 6.30% |
| Average Duration | ~3.47 years |
| Leverage Ratio | ~39.1% of assets |
| Monthly Distribution | ~$0.0706 per share |
| Average Credit Quality | BBB/BBB- |
Head-to-Head: What Each Fund Is Actually For
Comparing EVV and VOO on a yield or return basis alone produces misleading conclusions. Specifically, the two funds target different risk profiles, different investor needs, and different market exposures. The table below summarizes the structural distinctions.
| Comparison Factor | VOO | EVV |
|---|---|---|
| Asset Class | U.S. large-cap equity | Fixed income (loans, MBS, HY bonds) |
| Structure | Open-end ETF | Closed-end fund |
| Yield (trailing) | ~1.07% | ~8.9% |
| Leverage | None | ~39.1% of assets |
| Expense Ratio | 0.03% | Higher (includes leverage costs) |
| Price vs. NAV | Trades at or near NAV | Trades at ~6.62% discount |
| Distribution frequency | Quarterly | Monthly |
| Primary risk | Equity market drawdown | Credit risk, leverage, rate sensitivity |
| Long-term growth potential | High (tracks equity index) | Low to moderate |
| Income level | Low | High |
Growth Investors
For investors with a long time horizon and a primary goal of building wealth, VOO is the more appropriate vehicle. It offers broad equity diversification, minimal costs, and direct participation in the earnings growth of 505 U.S. companies. Over the past decade, the S&P 500 has compounded at approximately 10% to 11% annually in nominal terms, and VOO has tracked that return closely. Moreover, the fund requires no monitoring of leverage ratios, discount dynamics, or distribution coverage ratios.
Income-Oriented Investors
For investors who need current cash flow, whether retirees drawing income or those building a dividend portfolio, EVV’s 8.9% distribution rate is genuinely attractive relative to alternatives in the investment-grade and near-investment-grade fixed income universe. However, investors must accept several trade-offs: leverage risk, credit risk in below-investment-grade holdings, distribution sustainability uncertainty, and the structural complexity of the closed-end format.
Additionally, EVV’s monthly distribution cadence (versus VOO’s quarterly payments) can be appealing for cash flow planning purposes. Furthermore, the 6.62% discount to NAV offers a modest margin of safety on the entry price, though that discount has been a persistent feature rather than a temporary opportunity.
The Interest Rate Backdrop in 2026 and What It Means for Each Fund
The Federal Reserve’s rate path remains a key variable for both funds, though in very different ways.
VOO and Rate Expectations
For VOO, the primary rate-related dynamic is the effect of monetary policy on equity valuations. Analysts at UBS Global Wealth Management raised their 2026 year-end S&P 500 target to 7,900 from 7,500, citing resilient consumer spending and demand for data center infrastructure. Generally, rate cuts tend to expand P/E multiples and support equity prices. Consequently, if the Fed delivers meaningful easing in the second half of 2026, VOO could benefit from multiple expansion on top of underlying earnings growth.
EVV and Rate Sensitivity
For EVV, the calculus is more nuanced. Because the fund holds significant floating-rate loan exposure, falling rates would reduce the income generated by those positions. Specifically, floating-rate loans reset periodically based on benchmark rates, meaning a lower-rate environment directly compresses the yield on that portion of the portfolio. As a result, rate cuts that benefit equity investors could actually reduce EVV’s income generation capacity.
Furthermore, the fund’s heavy leverage amplifies both upside and downside. In a benign credit environment with stable or improving spreads, leverage enhances returns as it did in the 12-month period ended March 2026. However, a credit stress event, particularly one affecting leveraged loans or high-yield bonds, could cause rapid NAV erosion because the fund’s borrowings must be serviced regardless of portfolio performance.
What Ordinary Investors Should Take Away
The EVV vs. VOO comparison ultimately comes down to one fundamental question: do you need income now, or are you building for the future?
Building for the Future
If you have a 10-plus-year investment horizon and do not need current cash flow from the portfolio, VOO is a difficult fund to argue against. Its near-zero costs, deep liquidity, and direct exposure to U.S. corporate earnings growth make it a sensible core holding for most equity allocations. Notably, the 1.07% dividend yield is low in isolation, but total return investing captures both the income and the price appreciation, which has historically averaged well above what any fixed income vehicle delivers over long periods.
Generating Current Income
If, conversely, you are in drawdown mode or need regular distributions, EVV’s 8.9% yield and monthly payment schedule address a real portfolio need. In that context, it is best evaluated alongside similar closed-end income funds rather than against an equity ETF. Alternatives worth comparing include other Eaton Vance closed-end funds and credit-focused peers, assessed on metrics like distribution coverage ratio, NAV trend, discount history, and leverage cost relative to portfolio yield.
The Blended Portfolio Approach
Many investors would be best served by holding both, in proportions that reflect their income needs and growth objectives. For instance, a retiree might allocate primarily to income-generating closed-end funds like EVV while retaining a smaller equity allocation through VOO for long-term purchasing power preservation. That structure captures current income without abandoning equity exposure entirely.
Forward Outlook
VOO’s near-term direction will be driven primarily by the trajectory of S&P 500 earnings, the Federal Reserve’s rate decisions, and the performance of its large technology holdings. Wall Street consensus as of mid-2026 projects roughly 9% to 12% S&P 500 upside to year-end, with analysts pointing to AI-driven capital expenditure and resilient consumer spending as the primary supports. Specifically, if the consensus year-end S&P 500 target of approximately 7,555 materializes, VOO’s implied price range is approximately $690 to $750 by year-end.
For EVV, the more pressing question is distribution sustainability and NAV stability. As long as credit spreads remain contained and leveraged loan default rates stay low, the fund can continue delivering its current distribution level. However, any meaningful deterioration in credit conditions would test the fund’s leverage structure and potentially force distribution cuts or NAV erosion. Investors should monitor the fund’s quarterly reports closely, paying particular attention to the coverage ratio and any changes in leverage.
In aggregate, both funds have demonstrated their value in 2026. However, they serve different masters. VOO is a growth engine. EVV is an income machine with a lever attached. Neither is wrong. Understanding which job you need done is everything.
Conclusion
The EVV vs. VOO debate is really a conversation about investment philosophy rather than fund selection. VOO has returned 27.24% over the trailing 12 months, carries essentially zero cost, and gives investors the full return of the U.S. equity market with nothing in between. EVV has returned 6.30% at NAV over its most recent 12-month reporting period, distributes approximately 8.9% annually, and trades at a meaningful discount to its underlying holdings. Both numbers are honest. Both funds do what they advertise. The investor who chooses well is the one who is clear about what they actually need.
Disclaimer: This article is for informational purposes only and does not constitute investment advice or a recommendation to buy, sell, or hold any security. All financial data referenced in this article is based on publicly available information as of June 2026 and is subject to change. Past performance is not indicative of future results. Investing involves risk, including the potential loss of principal. Closed-end funds involve additional risks including leverage risk, credit risk, and the risk that shares may trade at a discount to net asset value. Investors should consult a qualified financial advisor before making any investment decisions.