Sixty-three years after its first mutual fund launched in Boston, Fidelity Investments remains one of the most consequential forces in global asset management. The firm does not trade on a public exchange, does not answer to outside shareholders, and does not run glossy television advertisements extolling its virtues. Yet as of June 2026, Fidelity oversees $16.4 trillion in assets under administration, including $6.4 trillion in discretionary assets, which encompasses its mutual funds, ETFs, and managed accounts. That scale is not merely a headline number. It is the foundation of a competitive advantage that no rival has fully replicated: the ability to charge nothing at all and still earn a profit.
Understanding how Fidelity built that machine, and what it means for investors navigating the market in 2026, requires looking beyond the fund scorecards. The real story runs through fee wars, succession drama, the quiet triumph of the ZERO fund line, and a strategic posture that keeps Fidelity simultaneously competing on price with Vanguard and on performance with every active manager on the Street.
Scale, History, and the Boston Advantage
A Privately Held Giant in a Public Industry
Most of the world’s largest asset managers are publicly traded companies. BlackRock, whose iShares suite anchors roughly $11 trillion in global ETF assets, reports quarterly to Wall Street. Vanguard is structured as a cooperative owned by its fund shareholders. Fidelity takes a different path entirely. The firm is privately held, controlled by the Johnson family, which has owned it across three generations. Abigail Johnson, granddaughter of founder Edward C. Johnson II, has served as CEO since 2014.
Consequently, Fidelity does not face the quarterly earnings pressure that shapes strategy at its publicly traded rivals. Moreover, the firm can absorb the cost of offering zero-fee index funds as a customer acquisition strategy without having to explain the margin impact to equity analysts at an earnings call. That structural freedom, often overlooked in fund comparisons, is arguably what made the ZERO fund line possible in the first place.
As of June 30, 2025, Fidelity’s total assets under administration reached $16.4 trillion. Of that figure, $6.4 trillion represents discretionary assets, meaning investment products the firm actively manages or runs, including mutual funds and ETFs. By comparison, Fidelity’s closest peer on the mutual fund side, Vanguard, manages approximately $10 trillion in total assets but operates almost entirely through passively managed index vehicles. Fidelity, by contrast, straddles both worlds simultaneously: it runs some of the most successful actively managed equity funds in the country while also offering index products that undercut Vanguard’s already razor-thin expense ratios.
A Product Range Built for Every Investor
Fidelity’s mutual fund catalog currently spans approximately 200 products. That breadth covers domestic and international equity, taxable and tax-exempt fixed income, balanced and asset allocation funds, sector-focused portfolios, target-date retirement funds, and the flagship ZERO index series. Notably, no minimum investment is required for most Fidelity mutual funds. In practice, that means an investor could begin with a single dollar, a structural feature that sets the firm apart from rivals that still enforce minimums ranging from $1,000 to $3,000 for many fund classes.
Furthermore, investors do not need a Fidelity brokerage account to access Fidelity funds. Most major brokerages and retirement accounts allow Fidelity fund purchases, which makes the product line broadly accessible across the industry. The one significant exception is the ZERO fund series, which remains exclusive to the Fidelity platform, a portability tradeoff discussed in detail below.
The Fee Wars: How Fidelity Changed the Industry
From Expense Compression to Zero
The story of mutual fund fee competition over the past two decades is largely a story about Vanguard’s influence forcing rivals to respond. When Vanguard pioneered no-load index investing under Jack Bogle, the industry average expense ratio on equity mutual funds exceeded 1.0%. Over the following decades, Fidelity, Schwab, and BlackRock all entered the index fund space, driving expenses progressively lower. By the mid-2010s, broad-market index funds were available at 0.10% or less.
Then, in August 2018, Fidelity crossed a threshold that the industry had considered a theoretical limit: it launched the ZERO fund series with a 0.00% expense ratio, the first such products offered by a major fund company. The initial lineup included the Fidelity ZERO Total Market Index Fund (FZROX) and the Fidelity ZERO International Index Fund (FZILX), followed subsequently by the Fidelity ZERO Large Cap Index Fund (FNILX) and the Fidelity ZERO Extended Market Index Fund (FZIPX).
FZROX: Nearly Eight Years of Proof
As of early 2026, FZROX has accumulated nearly eight years of live performance history, and the results are worth examining with precision. Over the one-year period ending in early March 2026, FZROX returned 18.48%, outperforming the SPDR S&P 500 ETF Trust (SPY) at 17.69% and Vanguard’s Total Stock Market ETF (VTI) at 17.67%. Over the five-year period, FZROX returned 81.75% cumulatively, again ahead of SPY at 75.69% and VTI at 65.3%. The fund’s top holdings as of that period were Apple, Nvidia, and Microsoft, reflecting its exposure to the full U.S. equity market including large-cap technology concentration.
The performance advantage relative to SPY and VTI is not large in absolute terms, but its direction is meaningful. Zero cost compounds in the investor’s favor with every passing year. A 0.03% annual cost differential on a $200,000 investment over 30 years at 7% growth produces approximately $1,800 in additional compounding. That is not a transformative number for a wealthy investor, but it is real money for someone in a 401(k) program. Furthermore, when Fidelity also beats on performance before fees, the case for FZROX becomes straightforward.
One important caveat applies: FZROX and the other ZERO funds are not portable. They are mutual fund products available only on the Fidelity platform, which means investors cannot transfer them in-kind to another brokerage if they ever change custodians. That portability constraint is not a trivial consideration for investors who consolidate accounts across multiple institutions.
Index Fund Expense Ratios: Where Fidelity Stands in 2026
As of February 2026, Fidelity claims to beat or match Vanguard on expenses for all comparable stock and bond index funds, measuring across Vanguard share classes with minimums below $5 million. That is a meaningful competitive claim given Vanguard’s historic reputation as the low-cost leader. The fee competition has effectively reached a floor: for broad index products, expense ratios are now so low that differences in absolute terms matter only at large asset balances held over very long time horizons.
The table below summarizes key expense ratios for major Fidelity index funds and their closest competitors as of June 2026:
| Fund | Ticker | Expense Ratio | Benchmark | Minimum |
|---|---|---|---|---|
| Fidelity ZERO Total Market Index | FZROX | 0.00% | Fidelity U.S. Total Investable Market Index | $0 (Fidelity only) |
| Fidelity ZERO International Index | FZILX | 0.00% | Fidelity Global ex U.S. Index | $0 (Fidelity only) |
| Fidelity 500 Index Fund | FXAIX | 0.015% | S&P 500 | $0 |
| Vanguard Total Stock Market Index | VTSAX | 0.04% | CRSP US Total Market | $3,000 |
| Vanguard 500 Index Admiral | VFIAX | 0.04% | S&P 500 | $3,000 |
| iShares Core S&P 500 ETF | IVV | 0.03% | S&P 500 | Market price |
The Active Management Story: Contrafund and the Danoff Era
A 36-Year Run Comes to an End
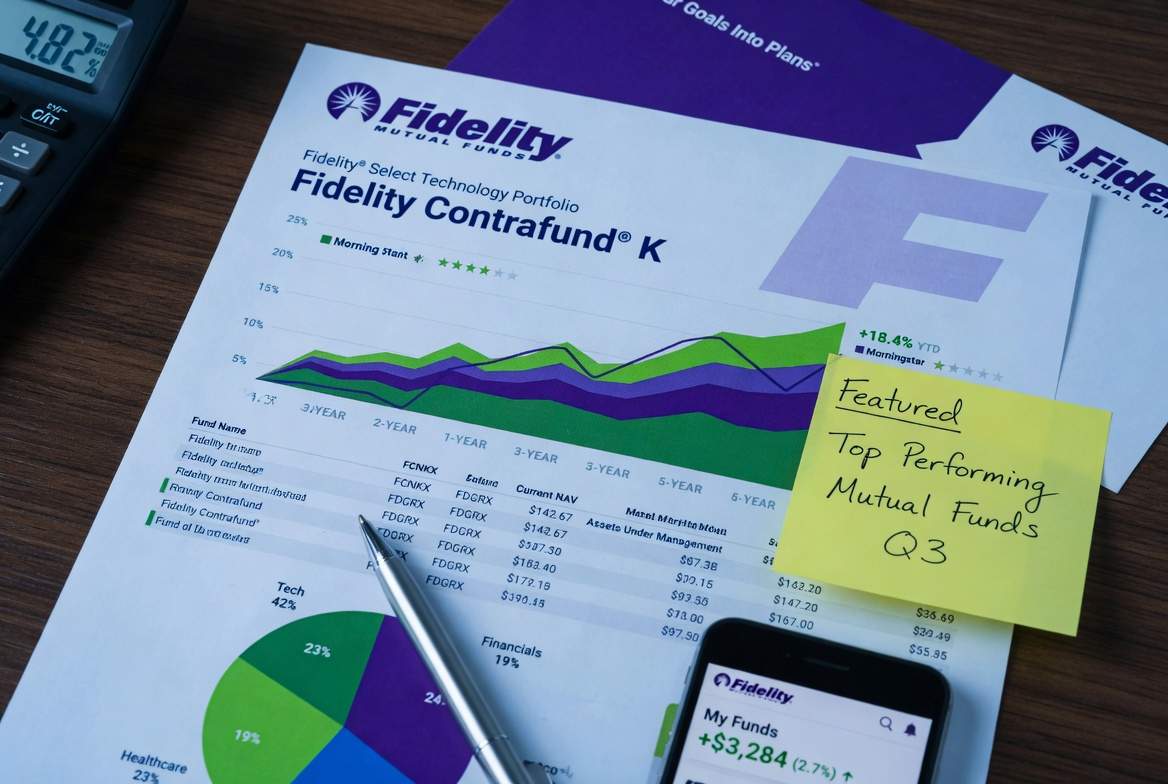
No discussion of Fidelity’s mutual fund lineup is complete without Fidelity Contrafund (FCNTX), one of the largest actively managed mutual funds in the world. As of early 2026, Contrafund manages $176.3 billion in fund assets, with more than $360 billion across the fund and its related strategies when institutional share classes and separately managed accounts are included.
What makes Contrafund remarkable is not simply its size but its performance over an extended and challenging time horizon. Since William Danoff took over as portfolio manager in 1990, the fund has delivered an average annual return of 14.1%, compounding against multiple market cycles including the dot-com collapse, the 2008 financial crisis, the 2020 pandemic selloff, and the 2022 growth-stock correction. That track record, maintained across more than three decades, places Danoff among the most accomplished active managers in mutual fund history.
However, Contrafund’s era is transitioning. In January 2026, Fidelity confirmed that Danoff, now 65 years old, will retire effective on or about December 31, 2026. His stock-picking responsibilities at Contrafund will pass to co-portfolio managers Asher Anolic and Jason Weiner, who joined the fund’s management team in April 2025. Danoff will remain with Fidelity in an advisory capacity following his departure.
The Succession Plan at Contrafund
The transition was structured deliberately. Between April 2025 and November 2025, roughly 30% of Contrafund’s assets were reallocated under Anolic and Weiner’s direction, primarily through changes in position sizes rather than wholesale portfolio reconstruction. That gradual handover is consistent with Fidelity’s historical approach to large-fund succession: avoid abrupt stylistic shifts that could trigger performance instability or large-scale redemptions.
Anolic and Weiner bring a collaborative history. Prior to joining Contrafund, the pair had managed Fidelity Growth Discovery Fund (FDSVX) together, a large-growth vehicle benchmarked to the Russell 3000 Growth Index. Their combined background emphasizes growth-oriented stock selection within U.S. large-cap equities, which aligns closely with Contrafund’s established investment philosophy. Morningstar placed the fund’s Medalist Rating under review following the succession announcement, reflecting standard analytical practice when manager continuity is disrupted at a fund of this scale.
Contrafund’s Recent Performance in Context
Despite the management transition, Contrafund’s recent returns have been strong in absolute terms. The fund returned 21.80% in 2025, outperforming the S&P 500’s 17.88% return for the same period. That result extended a pattern of outperformance seen in the fund’s most recent multi-year record: 39.33% in 2023 and 35.97% in 2024, versus the S&P 500’s respective returns over those years. The fund’s five-year average annual return through 2025 stood at approximately 15.54%, above its benchmark.
The table below shows Contrafund’s year-by-year returns over the past decade alongside the S&P 500 benchmark:
| Year | FCNTX Return | S&P 500 Return |
|---|---|---|
| 2016 | 3.36% | 11.96% |
| 2017 | 32.21% | 21.83% |
| 2018 | -2.13% | -4.38% |
| 2019 | 29.98% | 31.49% |
| 2020 | 32.58% | 18.40% |
| 2021 | 24.36% | 28.71% |
| 2022 | -28.26% | -18.11% |
| 2023 | 39.33% | 26.29% |
| 2024 | 35.97% | 25.02% |
| 2025 | 21.80% | 17.88% |
Source: Fidelity SEC filings, as of January 2026.
The 2022 underperformance stands out: Contrafund lost more than the S&P 500 in a year of broad market decline, reflecting its structural overweight to high-growth technology and consumer names that sold off disproportionately during the rate-hike cycle. That pattern is characteristic of growth-tilted active funds and represents a genuine risk that investors should weigh against the fund’s long-term alpha record.
Fidelity Magellan: The Legend That Stabilized
From Peter Lynch to a Different Era
Fidelity Magellan (FMAGX) carries perhaps the most famous name in active mutual fund history. Under Peter Lynch’s management from 1977 to 1990, Magellan returned an average of 29.2% annually, building a reputation that attracted tens of billions of dollars in assets and introduced an entire generation to equity investing. Subsequent managers never fully recaptured that performance, and by the early 2000s Magellan had declined from its status as the world’s largest mutual fund.
In 2026, Magellan is a much smaller and more modest vehicle. Its net assets stand at approximately $24.2 billion, and the fund carries a 0.56% expense ratio, making it mid-priced relative to other Fidelity active strategies. Recent returns have been adequate but not exceptional: the fund returned 28.03% in 2024 and 10.58% in 2025, trailing its large-growth category peers in both periods based on trailing data through May 2026.
The Magellan Investment Case in 2026
Magellan’s sector allocation as of mid-2026 shows 38.97% in technology, 16.16% in industrials, and 14.26% in financial services, followed by consumer cyclical at 12.62%. That diversification across industrials and financials distinguishes Magellan from more concentrated growth funds, suggesting the current management team is running a somewhat blended large-cap strategy rather than a pure growth portfolio.
For investors seeking a legacy Fidelity active fund with moderate fees and diversified large-cap exposure, Magellan remains relevant. Nevertheless, its 3-star Morningstar rating as of June 2026 suggests analysts do not view it as a top-tier active vehicle relative to its category. Specifically, the fund’s trailing returns through late May 2026 showed a 1-year return of approximately 4.35% against a category average of 12.38%, reflecting softer performance in the current momentum-driven market environment.
The Broader Fidelity Active Fund Universe
Flagship Funds Worth Knowing
Beyond Contrafund and Magellan, Fidelity’s active lineup includes several funds with strong long-term track records that merit attention.
Fidelity Growth Company Fund (FDGRX) is among the most aggressive growth vehicles in the lineup, concentrating heavily in high-growth technology and healthcare names. The fund has historically posted some of the highest long-term returns in Fidelity’s catalog, though its volatility profile is correspondingly elevated.
Fidelity Blue Chip Growth Fund (FBGRX) focuses on established large-cap growth companies, with an emphasis on businesses that dominate their sectors through brand strength or market share. As of June 2026, the fund traded at approximately $290 per share, reflecting substantial appreciation over the past decade.
Fidelity Equity-Income Fund (FEQIX) takes a different approach, prioritizing dividend-paying and value-oriented large-cap stocks. This positioning made the fund more resilient during the 2022 growth selloff and continues to attract investors seeking income alongside capital appreciation.
Fidelity Puritan Fund (FPURX) is a balanced fund, allocating roughly 60% to equities and 40% to fixed income. Target-date investors who prefer to manage their own glide path sometimes use Puritan as a core holding. As of June 2026, the fund trades at approximately $28.49 per share.
The Morningstar Gold Standard
Morningstar’s Gold Medalist rating, the highest tier in the firm’s forward-looking assessment framework, applies to funds where analysts expect the investment vehicle to produce positive alpha relative to its category index over at least five years. As of June 2026, a select group of Fidelity funds carry this distinction. Morningstar’s Gold rating specifically indicates an expectation of above-category performance, not just historical outperformance, making it a relevant screening tool for investors seeking active funds with durable structural advantages.
It is important to note, however, that active fund selection based solely on past performance is methodologically problematic. As multiple analysts and institutional researchers have consistently documented, survivorship bias inflates the historical track records of funds that remain open today, since poorly performing funds are regularly merged or closed, removing them from historical comparisons.
Target-Date Funds: Fidelity Freedom and the Glide Path Approach
How Fidelity’s Target-Date Series Works
For retirement investors who prefer simplicity over fund selection, Fidelity offers the Freedom Fund series of target-date funds, with vintages ranging from 2010 through 2065 and beyond. Each fund in the series is designed to hold a diversified mix of equities and fixed income that gradually becomes more conservative as the target retirement date approaches.
The Fidelity Freedom 2040 Fund (FFFFX), for example, held approximately 19% in bonds as of 2026, consistent with a roughly 14-year runway to its target retirement date. As the 2040 date approaches, the fund will progressively shift allocation away from equities and toward investment-grade bonds and other capital-preservation instruments. That automatic rebalancing removes the behavioral burden from investors and eliminates the need for ongoing portfolio maintenance.
The Case for and Against Target-Date Funds
Target-date funds carry higher expense ratios than pure index products because they layer an allocation management fee on top of the underlying fund costs. Consequently, cost-conscious investors who are willing to manage their own equity-to-bond ratio may prefer building a two-fund or three-fund portfolio using FZROX, FZILX, and a low-cost bond index fund, rather than paying the convenience premium embedded in a target-date structure.
Moreover, target-date funds assume a standardized glide path that may not match every investor’s actual risk tolerance or retirement timeline. An investor who plans to work part-time through their late sixties, for example, may not want the allocation conservatism that a 2035 fund applies to someone expected to fully retire in nine years.
What Fidelity Means for Ordinary Investors in 2026
The Real-World Advantage of Scale
For most retail investors, Fidelity’s scale translates into three concrete benefits in 2026. First, cost: the combination of ZERO index funds, ultra-low expense ratios on standard index products, and no account minimums means Fidelity is the most cost-efficient platform for investors starting from scratch. Second, access: the absence of investment minimums across most of the 200-fund catalog removes a significant barrier that has historically favored wealthier investors. Third, choice: the simultaneous availability of passive index vehicles, actively managed funds, target-date solutions, and sector strategies within a single platform allows investors to build portfolios of any complexity without changing custodians.
Furthermore, Fidelity’s banking integration adds a layer of convenience that pure investment platforms cannot match. The firm offers a cash management account, a debit card with ATM fee reimbursement, and direct deposit capabilities, which makes it possible to consolidate investing and everyday banking in one place.
The ETF vs. Mutual Fund Question
One structural consideration worth understanding is the difference between Fidelity’s mutual funds and ETF offerings. Mutual funds, including the ZERO series, price once daily at net asset value after market close. ETFs trade throughout the day at market prices, which introduces bid-ask spreads but also allows intraday liquidity. For long-term buy-and-hold investors in tax-advantaged accounts, the distinction is largely irrelevant. For investors in taxable accounts, ETFs generally offer superior tax efficiency because their creation-redemption mechanism allows the fund to avoid realizing capital gains during routine portfolio rebalancing.
However, Fidelity’s ZERO index funds in mutual fund form offer something that most ETFs cannot: a 0.00% expense ratio with no bid-ask spread friction at all. The tradeoff is platform exclusivity. Investors who are confident they will remain Fidelity customers long-term and who primarily invest in tax-advantaged accounts have a strong case for the ZERO mutual funds. Those who value portability or operate primarily in taxable accounts may prefer Fidelity’s ETF lineup or low-cost funds available at any brokerage.
The Danoff Succession: What It Means for Contrafund Investors
Reading the Transition Correctly
The pending departure of William Danoff is the single most significant near-term event in Fidelity’s mutual fund universe. Danoff built Contrafund into a $176 billion vehicle over 36 years by combining extraordinary research depth, high portfolio concentration in conviction positions, and willingness to hold winning stocks through volatility. His largest historical positions, at various points, have included Facebook (now Meta Platforms), Amazon, and Alphabet, each held for years through significant drawdowns.
Anolic and Weiner’s background is credible. Their work together at Fidelity Growth Discovery was competent, and Fidelity’s structured transition preserves institutional knowledge rather than creating an abrupt break. Nevertheless, investors should acknowledge that 36-year track records are not transferable. The alpha Danoff generated was partly a function of personal investment philosophy, hard-won analytical relationships, and a management tenure long enough to compound the compounders through multiple cycles.
Three Scenarios for Post-Danoff Contrafund
Scenario 1 (Continuity case): Anolic and Weiner prove capable growth stock selectors, the fund’s existing portfolio positions continue to compound, and Contrafund maintains its above-benchmark track record with modest volatility around the transition. Implied 5-year annualized return, 12% to 16%, consistent with recent history.
Scenario 2 (Modest reversion case): Without Danoff’s concentration discipline, the fund drifts toward a more diversified large-growth posture, reducing both upside potential and downside risk. Performance converges toward the S&P 500 with a slight growth tilt, delivering 10% to 13% annualized. This is arguably the most likely base case.
Scenario 3 (Redemption pressure case): Institutional and retail investors who followed Danoff personally begin redeeming assets after his exit. Forced selling of large concentrated positions creates performance headwinds in the transition year, and the fund underperforms the S&P 500 for one to two years before stabilizing. Implied 5-year annualized return from current levels, 7% to 10%, below benchmark.
Investors holding Contrafund in a taxable account should assess their embedded gains carefully before the transition completes in December 2026. Selling may trigger capital gains. Holding through the transition carries manager-change risk that is real even if not immediately quantifiable.
Forward Outlook: Where Fidelity’s Mutual Fund Business Goes From Here
The Active vs. Passive Pendulum
Broadly, the asset management industry continues its decade-long drift toward passive investing. As of 2026, passive strategies represent the majority of U.S. mutual fund and ETF assets for the first time in history, a structural shift driven by overwhelming evidence that most active managers underperform their benchmarks net of fees over long time horizons. Fidelity sits on both sides of that divide. Its ZERO and index fund lineup competes directly with Vanguard and iShares for passive dollars. Its active lineup, anchored by Contrafund and the sector fund series, competes for the minority of investors who still seek active management.
The interesting question for 2026 and beyond is whether Fidelity’s active funds can sustain performance above passive benchmarks in an environment where information advantages have compressed due to algorithmic trading, alternative data proliferation, and regulatory disclosure requirements. Contrafund’s post-Danoff performance will be a closely watched data point for the entire active management industry.
The ZERO Fund Line’s Long-Term Sustainability
Fidelity generates revenue on its ZERO fund investors through ancillary services: margin lending, securities lending within the funds themselves, and cross-selling of brokerage products, retirement accounts, and cash management services. The zero-fee model is therefore not truly costless from the firm’s perspective; rather, it reflects a customer acquisition and retention strategy funded by the firm’s broader service revenue.
As long as Fidelity remains privately held and operationally diversified, the ZERO model is sustainable. Furthermore, the funds have now demonstrated eight years of competitive performance relative to their benchmarks, providing investors with an evidence-based reason to remain on the platform rather than simply a fee-based one. That evidence base is the model’s most durable competitive asset.
The Competitive Landscape: Fidelity vs. Vanguard vs. iShares
Where Each Firm Wins
The three-way competition among Fidelity, Vanguard, and BlackRock’s iShares for mutual fund and index investing assets is the defining commercial contest in retail asset management. Each firm holds a structural advantage that the others cannot easily replicate.
Vanguard’s mutual structure, owned by its fund shareholders, creates an institutional commitment to cost minimization that does not depend on corporate profitability targets. Its ETF lineup, particularly VTI and VXUS, remains the standard reference point for global passive investing. Vanguard Personal Advisor Services, offering certified financial planner access at 0.30% annually, is among the most cost-efficient human advisory products available in the market.
iShares wins on ETF distribution, liquidity, and international breadth. The iShares Core suite is available on virtually every major brokerage platform globally, making it the default passive vehicle for institutional and retail investors outside the United States. Its trading volumes typically exceed Vanguard equivalents, which narrows bid-ask spreads and reduces effective transaction costs for large-volume traders.
Fidelity wins on platform comprehensiveness, active fund depth, and absolute cost at the index fund level. The combination of ZERO funds, no account minimums, integrated banking, and a 200-fund catalog covering every major asset class makes Fidelity the most versatile single-platform choice for a retail investor building a long-term portfolio from scratch.
| Feature | Fidelity | Vanguard | iShares (BlackRock) |
|---|---|---|---|
| Lowest index expense ratio | 0.00% (FZROX) | 0.03% to 0.04% | 0.03% (IVV, ITOT) |
| Account minimum | $0 (most funds) | $0 (ETFs), $3,000 (Admiral) | Market price (ETFs) |
| Active fund depth | Extensive | Limited | Minimal |
| Platform features | Excellent | Minimal | N/A (brokerage-dependent) |
| ETF portability | Yes (most funds) | Yes | Yes |
| ZERO fund portability | No | N/A | N/A |
| Human advisory | 0.50% (Fidelity Go) | 0.30% (VPAS) | N/A |
Conclusion: The Most Complete Mutual Fund Ecosystem in American Investing
Fidelity’s mutual fund lineup in 2026 represents the broadest and most structurally coherent product ecosystem available to American retail investors. The ZERO index fund series has proven its case over nearly eight years of live performance, validating the model at a scale that skeptics once doubted. The active fund franchise, while transitioning through the most significant succession event in its modern history, retains institutional depth that few competitors can match. The target-date series, while not the lowest-cost passive option available, continues to serve millions of retirement investors who value simplicity over optimization.
The near-term wildcard is unambiguously the Contrafund succession. How Anolic and Weiner perform without Danoff in the chair will be one of the most closely watched active management experiments of the next three to five years. The stakes are not merely financial: a sustained underperformance at a $176 billion fund could accelerate the industry-wide redemption trend away from active management, reinforcing the very passive funds that Fidelity also happens to offer.
For ordinary investors, the practical takeaway is straightforward. Fidelity offers the most cost-effective entry point into broad market investing through its ZERO fund series, a competitive active fund lineup anchored by a 36-year track record, and a platform comprehensive enough to serve an investor from their first $1 to retirement and beyond.
In a market where cost compounds as relentlessly as return, Fidelity has built its entire strategy around giving investors one less reason to leave, and in 2026, that strategy continues to work.
Disclaimer: This article is published for informational and educational purposes only and does not constitute investment advice, a recommendation to buy or sell any security, or an offer to provide financial services. Past performance is not indicative of future results. All financial figures are sourced from publicly available disclosures, SEC filings, and market data as of June 2026. Readers should conduct their own due diligence and consult a qualified financial adviser before making any investment decisions. investments-research.com does not hold positions in any funds mentioned in this article.