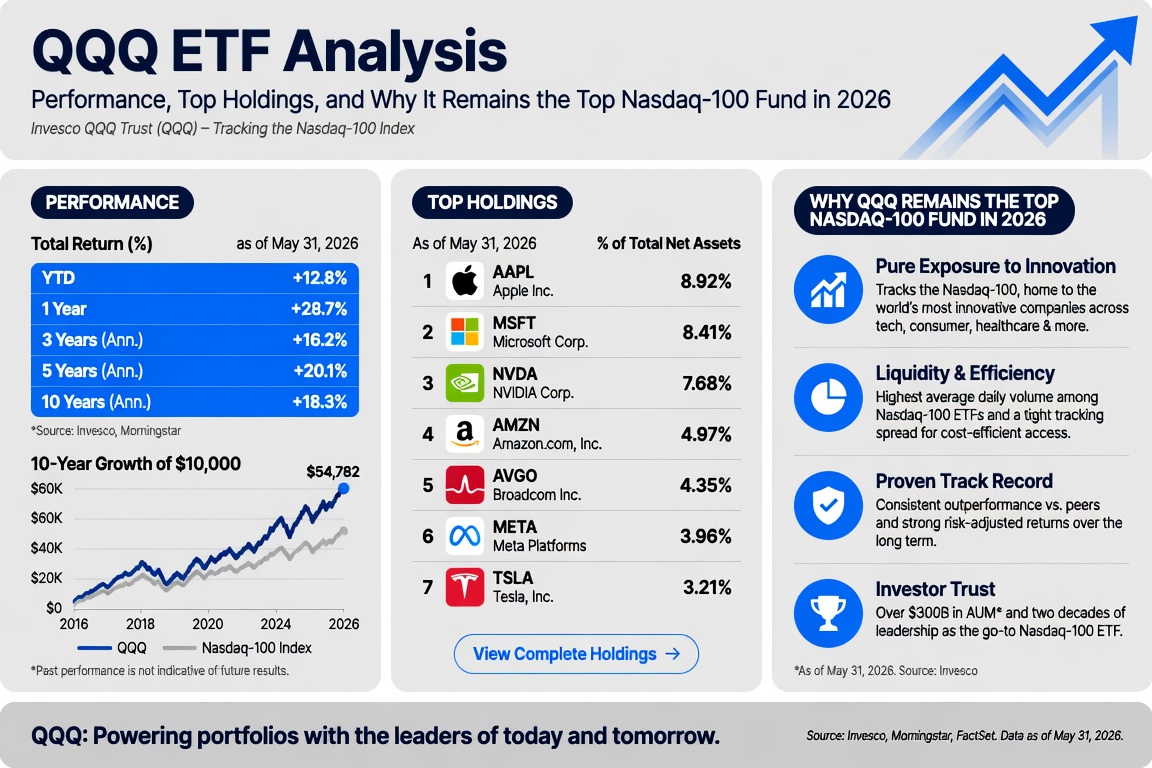
QQQ closed at $740.62 on June 18, 2026, up 2.51% on the day, and is sitting roughly 38% above its 52-week low of $523.65. The Nasdaq-100 has been in what multiple technical analysts are calling a parabolic bull run since April, and assets under management in QQQ have now crossed $494 billion. That is an impressive run. It is also the kind of run that demands scrutiny rather than celebration, because the catalysts driving it are not all structural, and at least one of them, a geopolitical ceasefire, carries obvious expiration risk.
Where QQQ Stands Right Now
QQQ’s 52-week range runs from $523.65 to $748.65. The all-time high was printed recently, and the fund has since pulled back slightly into a consolidation range between $724 and $741. Short and long-term moving averages are both issuing buy signals, with the short-term average holding above the long-term, which is a standard confirmation of trend strength. Support levels sit at $724.16 and $714.87. A breakdown below $714 would shift the short-term technical picture from bullish to cautious.
The 3-month MACD turned negative on June 4, 2026, and the 10-day RSI moved out of overbought territory on June 5th. These are not panic signals, but they do suggest the fund ran hard into the all-time high and is digesting those gains rather than continuing to accelerate. The momentum indicator flipped back above zero on June 18th, which historically in 80 comparable cases has preceded further upside. Volume rose alongside price on June 18th, which is the kind of confirmation technicians look for when assessing whether a move has institutional backing.
Year-to-date, QQQ is up approximately 15% as of mid-June 2026. Over the past 12 months the gain is 38.07%. The P/E ratio sits at 25.32, which is elevated relative to the broad market but not extreme given the earnings growth profile of QQQ’s top holdings.
What Drove the 2026 Rally: Three Distinct Phases
The 2026 price action in QQQ breaks into three distinct phases, and conflating them leads to a distorted read on where the fund goes from here.
The first phase was the selloff. QQQ entered the year under pressure. By March 30th, both the Nasdaq-100 and the S&P 500 had hit year-to-date lows. The VIX peaked at 31.05 on March 27th. The catalyst was geopolitical: escalating tensions between the United States and Iran, military strikes, and the closure of the Strait of Hormuz pushed Brent crude to around $109 per barrel. Q1 GDP came in at only +2.0% annualized, below the +2.3% consensus. For a growth-heavy fund like QQQ, that is a textbook adverse macro environment.
The second phase was the recovery. A two-week ceasefire was announced on April 8th, with Iran agreeing to reopen the Strait of Hormuz. Brent crude dropped roughly $14 per barrel in the days that followed. QQQ surged 2.90% on April 8th alone, recovered more than 8% from its March 30th low by month-end, and the Nasdaq-100 posted a new all-time high by April 30th. Tech stocks closed April as their best month since the early days of the COVID pandemic. The VIX collapsed from 31.05 to 21.04 within days of the announcement.
The third phase is the current one: a broader bull run driven by AI infrastructure spending, SpaceX’s IPO on June 12th injecting fresh speculative capital into the Nasdaq ecosystem, and a Federal Reserve that has signaled a shift in focus toward employment risk rather than inflation hawkishness. This phase is more structural than the April snap-back, but it is also the one that carries the most forward uncertainty.
The AI Spending Thesis: Real, But Under Scrutiny
AI infrastructure spending by the major hyperscalers inside QQQ’s top holdings is projected to exceed $650 billion in 2026. Microsoft, Amazon, Alphabet, and Meta have all maintained or expanded their AI capital expenditure programs, and that spending is flowing into earnings growth for semiconductor and cloud businesses across the Nasdaq-100. The technology sector, which represents over 50% of QQQ’s weight, is positioned for earnings expansion exceeding 46% amid strong semiconductor demand and data center buildout.
The more nuanced story is what AI is doing to demand patterns at the second and third tier of QQQ’s holdings. Agentic AI applications have shifted the GPU-to-CPU ratio. AI model training runs at roughly 8:1 GPU to CPU. Inference workloads drop that ratio to approximately 4:1, and agentic workflows may shift demand even further toward CPU-heavy processing. This has renewed institutional interest in Intel and AMD, both Nasdaq-100 constituents. Memory and high-capacity storage requirements for large AI model deployment have similarly driven a fresh bid for Seagate Technology and Western Digital, both added to the index in the December 2025 reconstitution.
The risk inside this thesis is straightforward: investors are watching cash flow statements for evidence that AI capex is generating real revenue rather than accumulating as a future write-down. Earnings scrutiny on return-on-investment for AI spending is intensifying heading into H2 2026. If the hyperscaler capex story starts looking like a buildout ahead of demand rather than a response to it, the multiple compression in QQQ’s top holdings would be significant and fast.
Top Holdings and Concentration Risk
QQQ’s top 10 holdings carry a combined weight of roughly 51.7%. Half the fund’s performance at any given moment is driven by fewer than a dozen companies. That concentration has been the engine of QQQ’s long-term outperformance and the primary reason the fund fell 32.49% in 2022. The current composition as of early 2026 looks like this:
| Company | Approximate Weight |
|---|---|
| NVIDIA | ~9.0% |
| Apple | ~7.6% |
| Alphabet (combined) | ~6.7% |
| Microsoft | ~5.7% |
| Amazon | ~5.5% |
| Broadcom | ~4.5% |
| Meta Platforms | ~3.7% |
| Tesla | ~3.0% |
NVIDIA at roughly 9% means a single export control announcement, earnings miss, or antitrust development can move QQQ by 1% to 2% intraday. That has happened multiple times in the last 18 months. Alphabet is defending a federal search monopoly ruling. Apple’s App Store model faces active litigation across multiple jurisdictions. Meta’s acquisition history is under FTC review. These are live processes, not hypothetical risks, and each sits at 3% to 9% of the fund’s total weight.
Historical Returns: The Full Picture
| Year | QQQ Total Return |
|---|---|
| 2020 | +48.60% |
| 2021 | +27.25% |
| 2022 | -32.49% |
| 2023 | +54.76% |
| 2024 | +25.60% |
| 2025 | Negative (YTD lows hit March 2026) |
| 2026 YTD | ~+15% (as of mid-June) |
QQQ has beaten the S&P 500 seven out of the last ten years as of March 31, 2026, ranks in the top 1% of large-cap growth funds for 15-year total return per Lipper, and holds a five-star Morningstar rating for 10-year risk-adjusted returns among 898 large-cap growth funds. The 2022 drawdown of 32.49% is not an outlier, it is a preview of what the fund does when the macro environment turns against growth. Anyone treating QQQ as a low-risk holding because of its long-term track record is reading the record selectively.
Key Risks for H2 2026
Three risks stand above the others heading into the second half of 2026.
The first is ceasefire fragility. The April recovery was event-driven. The Strait of Hormuz ceasefire between the United States and Iran is holding, but ship traffic in the Strait reportedly remained at a standstill even after the ceasefire announcement. A re-escalation that closes the Strait again would immediately pressure Brent crude higher, reignite inflation concerns, and force the Fed into a harder posture. QQQ fell to its year-to-date low under exactly that macro setup in March.
The second is Fed policy uncertainty. The FOMC has signaled that the balance of risks has shifted toward employment, which the market is reading as a path toward rate cuts. But Q1 GDP at +2.0% and input cost indexes running near their highest levels since 2022 are not a clean backdrop for easing. A scenario where growth slows and inflation stays sticky puts the Fed in an impossible position and QQQ in a difficult one given its rate sensitivity.
The third is AI earnings validation. The hyperscalers have been spending at a rate that implies extraordinary future returns. Investors are not yet seeing those returns materialize at scale in revenue terms. H2 2026 earnings seasons will be the test. If AI revenue growth accelerates and cash flow holds up, the bull case strengthens materially. If guidance softens or capex continues to outrun revenue, the multiple QQQ’s top holdings are trading at becomes very difficult to defend.
Technical Levels to Watch
| Level | Significance |
|---|---|
| $748.65 | All-time high / 52-week high |
| $740 to $741 | Recent consolidation ceiling |
| $724.16 | First moving average support |
| $714.87 | Second moving average support |
| $701 | Short-term bearish target on $717 breakdown |
| $523.65 | 52-week low (March 2026) |
A sustained break above $748.65 on volume would open the $760 to $776 range, which some technical analysts are flagging as a potential euphoric top target in the near term. A failure at $724 and loss of $717 shifts the short-term picture bearish with $701 as the next meaningful support. The Aroon Indicator entered an uptrend as of June 18th, historically followed by further gains in the following month in the majority of comparable instances.
Bottom Line
QQQ is up 38% over the past 12 months on the back of an AI infrastructure bull thesis, a geopolitical ceasefire that reversed a sharp drawdown, and a Fed that appears to be moving toward accommodation. All three of those tailwinds are real. None of them are guaranteed to persist through the second half of 2026.
The fund’s long-term track record is genuinely strong. The concentration risk is genuinely elevated. The current price action is technically constructive but showing early signs of distribution below the all-time high. Investors with existing positions have reason to hold. Investors looking to initiate at current levels are buying into a fund that has already repriced significantly from its March lows, with the next earnings catalyst cycle, and the AI revenue validation test that comes with it, arriving in July and August.
This article is for informational purposes only and does not constitute financial advice. Past performance does not guarantee future results. Always conduct your own research before making investment decisions.